Report templates
Building a Report template
Canopy has a report template “form” builder. This allows you to build the general layouts using headers, nested headers, rich-text blocks and tables.
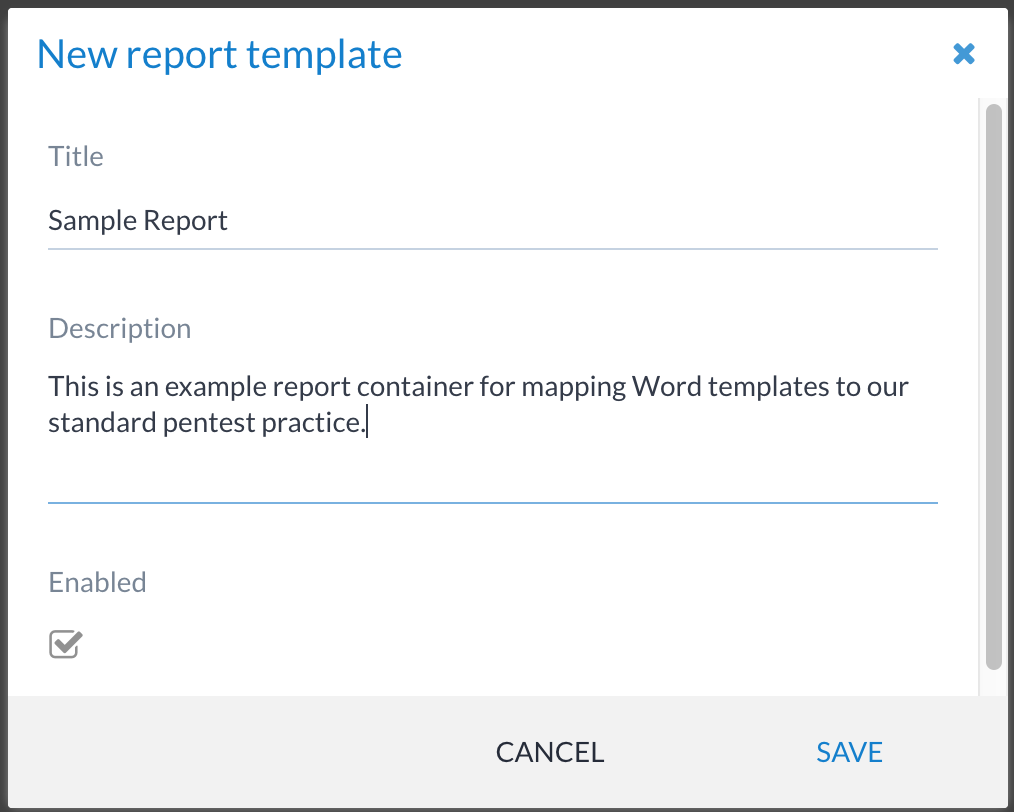
First, you create a report template by clicking on the 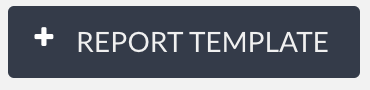 button
that can be found under Templates → Reports. This button shows the
following pop-up window:
button
that can be found under Templates → Reports. This button shows the
following pop-up window:
To add a new section (main heading) level click on the top level + button:
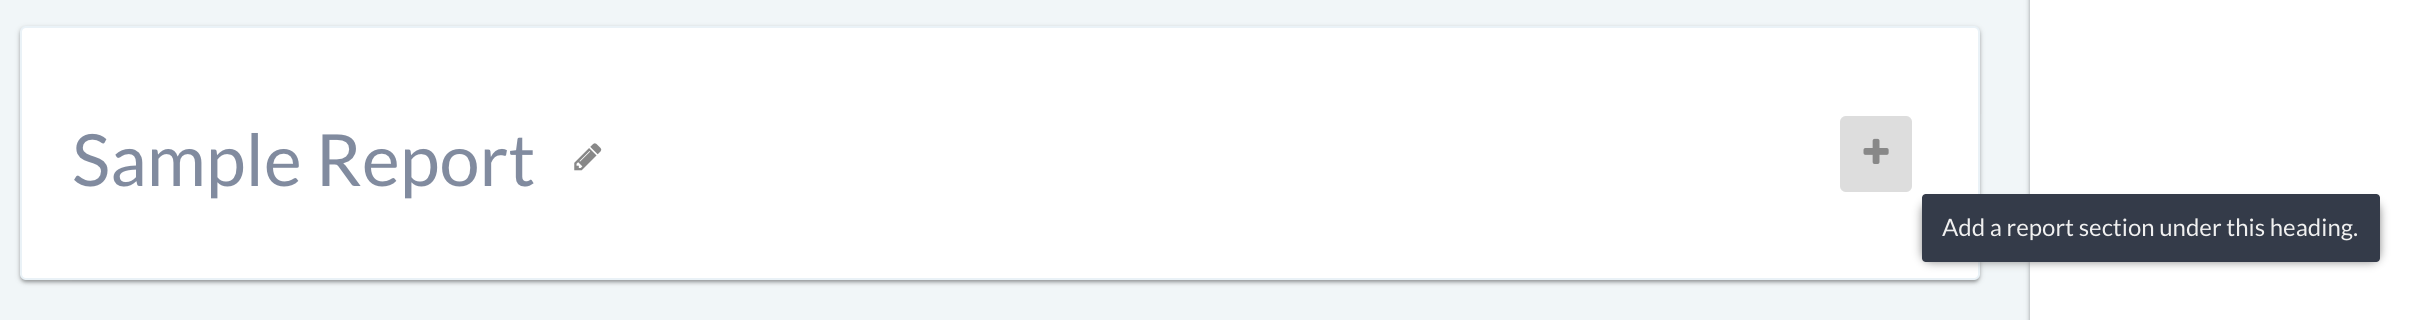
This pops up the New content window, which allows you to select three types of content types:
- Header
This can be a top-level or nested section header. It is just a named reference to (optionally) group text and table fields together.
- Table
A table can have one or multiple columns, and each column has the option of a pre-defined type (see below).
- Text
A rich text (WYSIWYG) field.
Selecting a type and then saving allows you to add to the structure of the document:
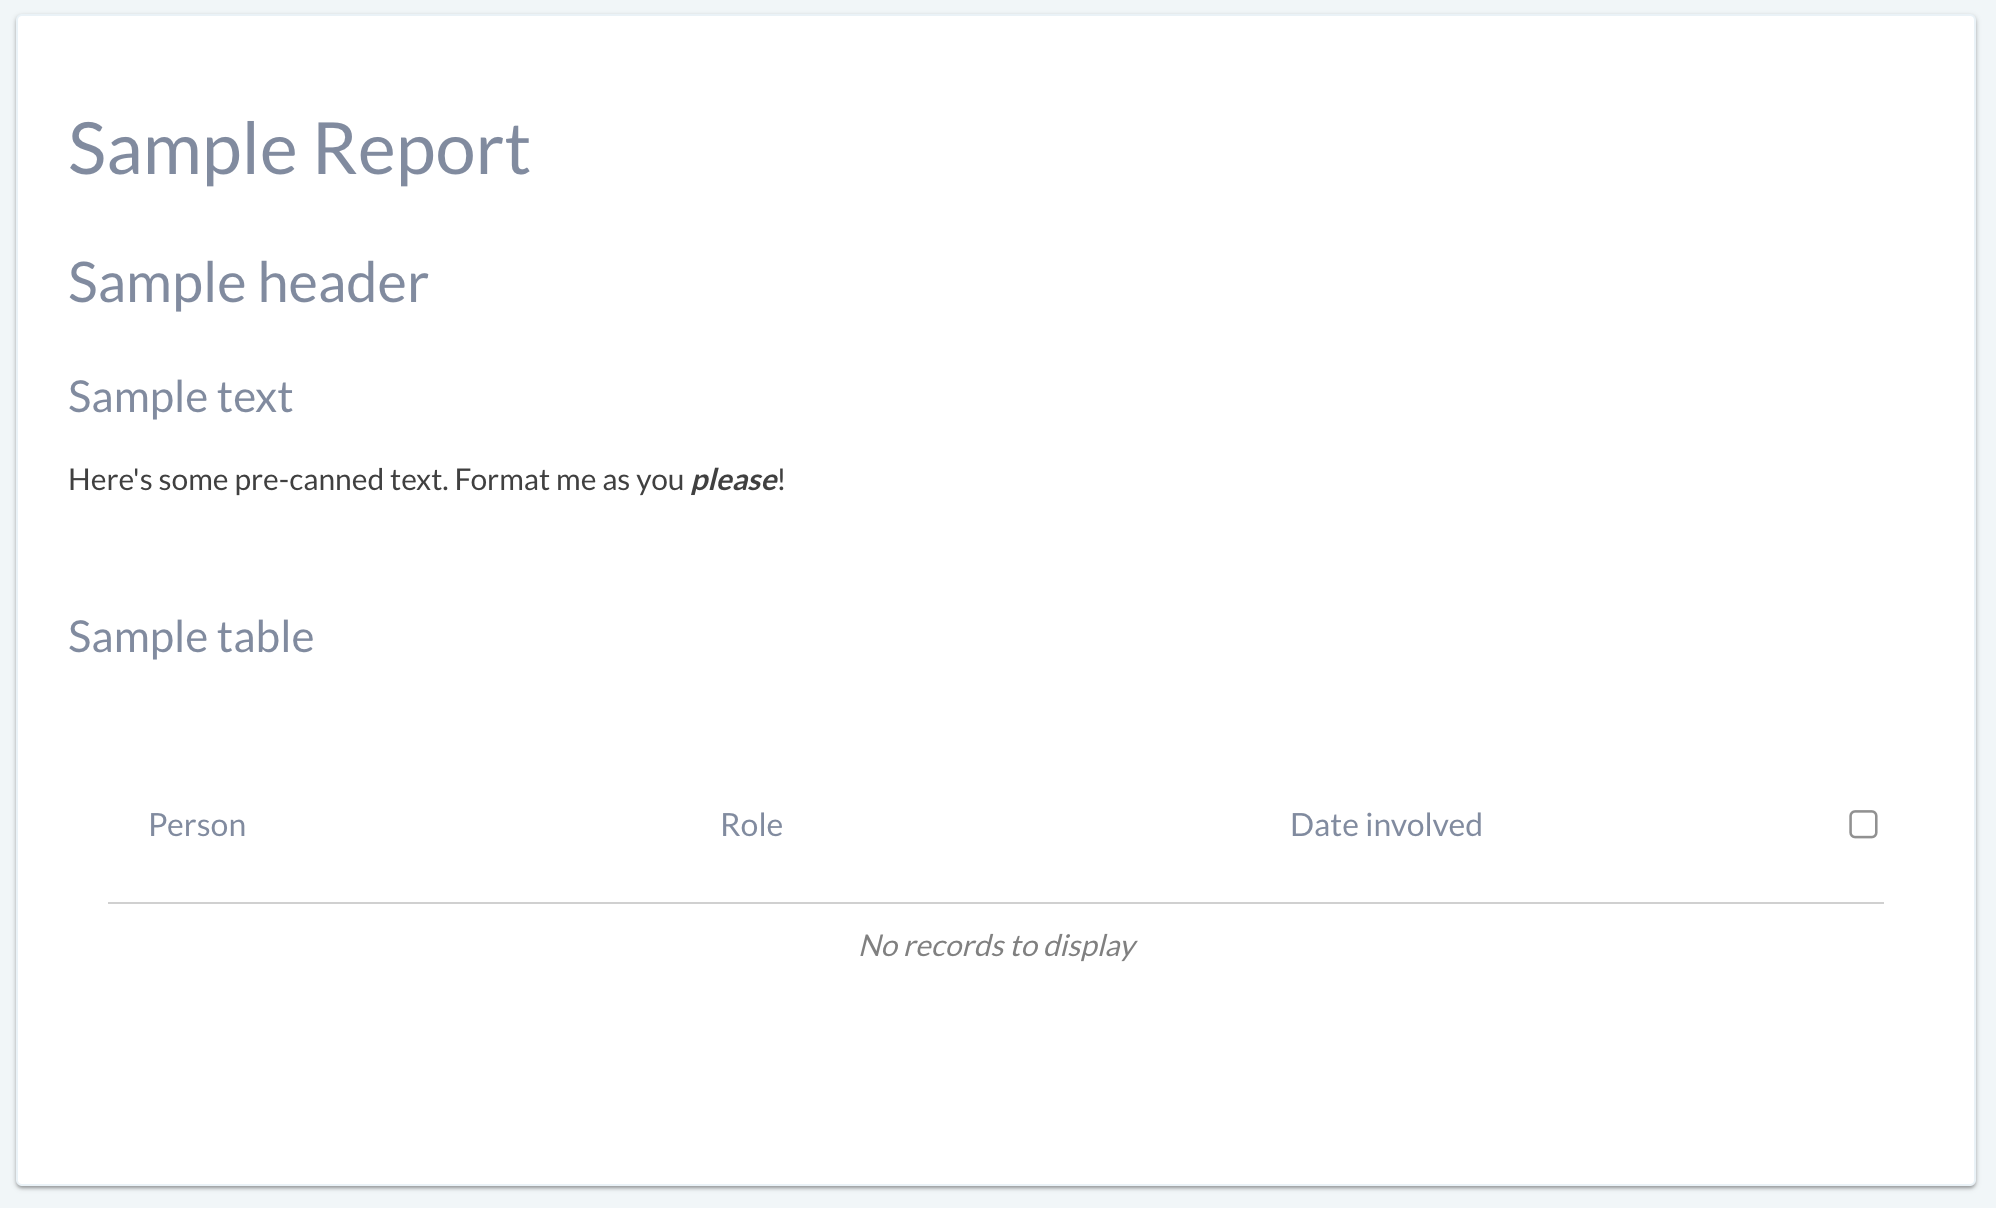
Once you add a section, you can also delete it or rename it. If it’s a table, you can also add/remove rows to the table:
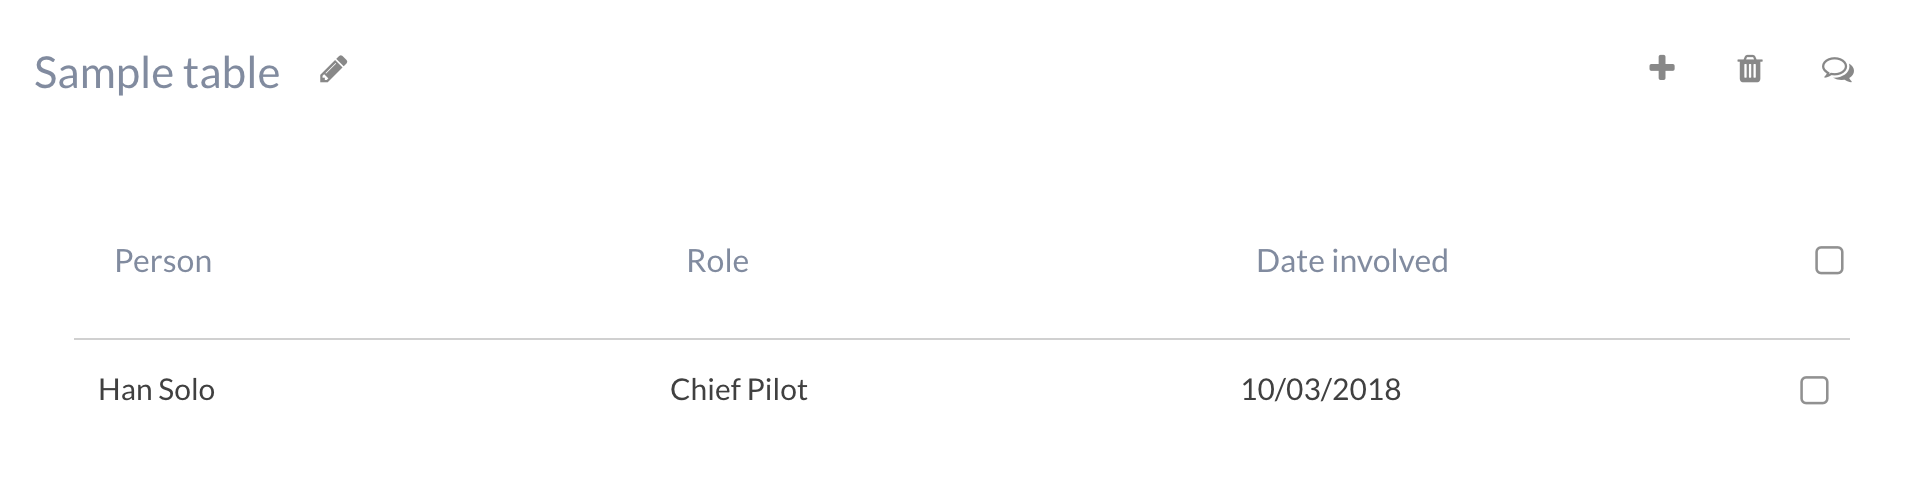
This table is using the Resource type for the Person column, the Text type for the Role column, and Date type for the Date involved column.
XML mapping document
Once a report template has been built, the XML mapping document can be exported from Canopy. This is a combination of the custom report structure, Canopy’s default data model and any other custom fields. This document can be exported by clicking on the Download mapping XML button in the follow screen:
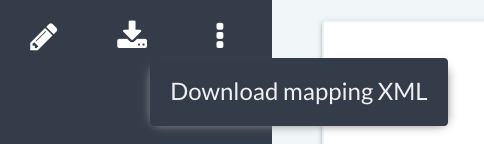
This outputs a file name $reportname.xml.
The XML document is structured around Canopy’s model hierarchy.
Section |
Description |
XPath |
|---|---|---|
|
This is the main root of the XML document. |
|
|
This is system specific data and is rarely used in customer reports, but may be useful for cross-referencing/labelling if required. |
|
|
The report section of the XML structure is where report specific fields (static and dynamic) are stored. Custom report structure and data (i.e. what is built based on the Building a Report template section above) is output under the |
|
|
This is the main starting point for the hierarchy of data within Canopy. Canopy groups its data under company (or “client”) containers. Company specific fields are available under the |
|
|
The |
|
|
The |
|
|
Canopy’s finding data is stored under different node hierarchies. Multiple node hierarchies are used to make Word template setup more convenient:
The above groupings are only made available for convenience purposes, since writing complex XPaths to look up data from a single tree hierarchy can be tricky and inefficient. |
|
|
The |
|
|
The |
|
|
The |
|
|
This section provides access to the reference fields. References are structured data sets used to store items such as CVE, CWE, and other types of reference information (public or private). |
|
|
This section comes after a findings section in a phase and is a special findings block that contains re-test history information. |
|
Setting up a Word template
Data stored in Canopy can be linked (mapped) to Word documents using the Canopy Word plugin. This can be downloaded from the CheckSec Portal. If you need access, please contact support via https://support.checksec.com. For information on installing the plugin, see Installing the report mapping plugin for Word [TODO].
The plugin allows you to import the Canopy data fields, along with your own custom report fields, and any custom fields you might have defined via the admin interface. This “data model” (output as an XML file) allows you to insert placeholders for data that will be populated during the report generation process. Around these data placeholders you can add logic for repeating (where you expect to have 0, 1 or more entries) and conditionals (“if” logic) that you can use to dynamically include/exclude pieces of data or even entire sections of a document (e.g. if you want a web app summary section to be added when web app findings are present, you can do that using conditionals - see below).
There are five main types of fields in use:
- Plain text
These are coloured with an orange border when inserted, and are labelled Data value.
- Rich text “XHTML”
These are coloured with a blue outline, and are labelled XHTML.
- Repeats
These are coloured blue and are labelled Repeat.
Note
There’s a bug that might cause this to not display the repeat label, and display it as Data label instead.
- Conditionals
These are coloured blue and are labelled Condition. The conditionals use XPath 1.0 functions to perform checks (e.g.
count, string comparison, boolean truth evaluation).- Date
These are coloured orange and are labelled Data value. When selected, they should display an option for selecting a date type.
These fields must be inserted using the CheckSec provided plugin. Fields inserted from the Developer tab may not function as expected.
Once the plugin has been installed, you’re now ready to map the Word document. In order to map the Word document, follow these steps:
When setting up Word templates, we recommend Design Mode be enabled as it helps with being precise from a data point insertion perspective. However, it can be helpful to turn it off when you want to review general layout and styling.
Open the Word document you’ve designed.
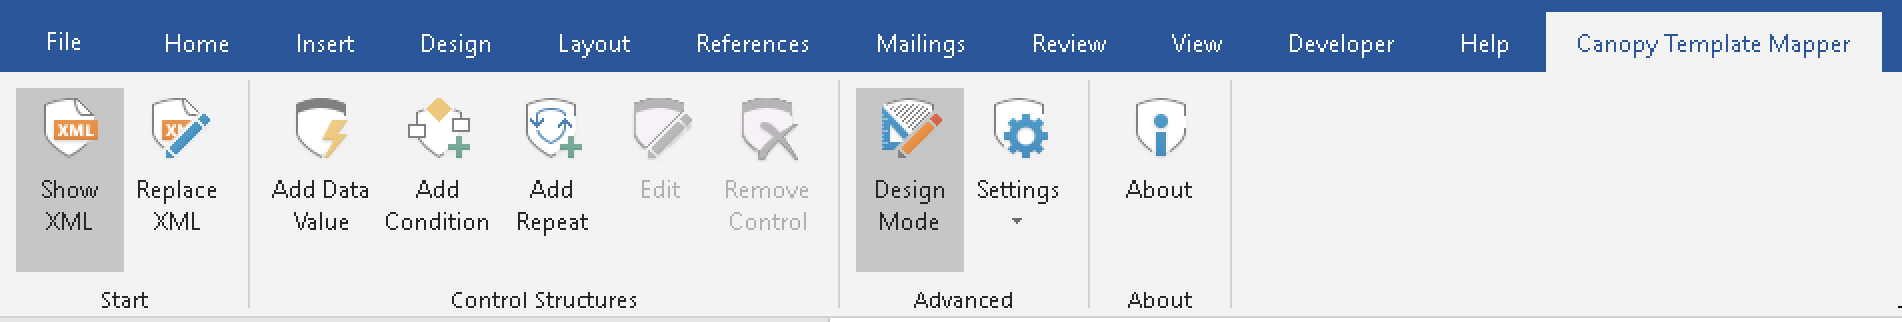
Click on the Canopy Template Mapper ribbon.
Click on Show XML. If the Canopy mapping XML document is not loaded, you will be asked to select one (this same dialogue is used for Replace XML).
The XML mapping panel is then displayed.
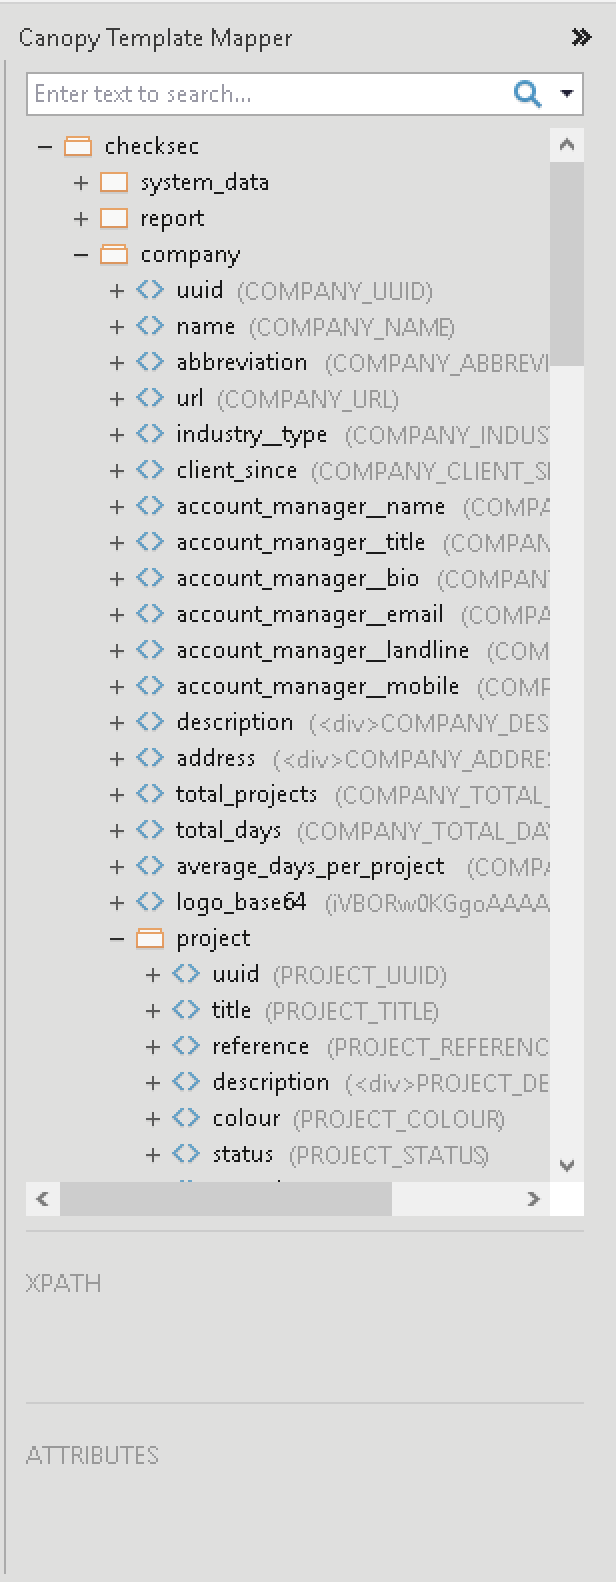
Data fields in the panel can be accessed by either drag-and-drop or using right-click and then inserting required option:
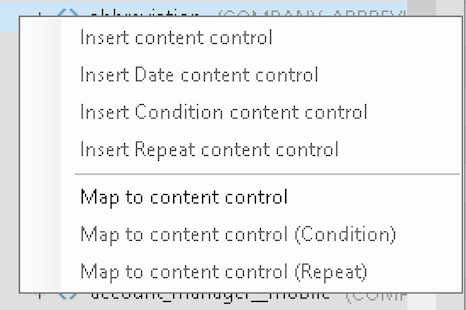
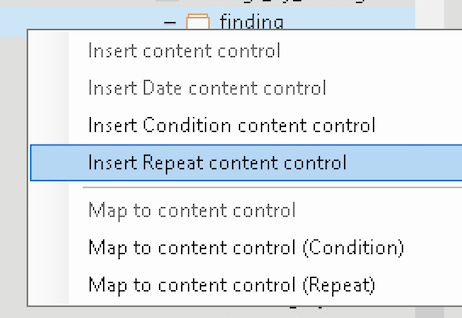
For Repeat sections - i.e. expandable nodes in the XML tree - the options for Insert Repeat content control will be available:
For example, if you wanted to insert a selection of data points from the finding structure and then repeat the section, you can build up a section like the following:
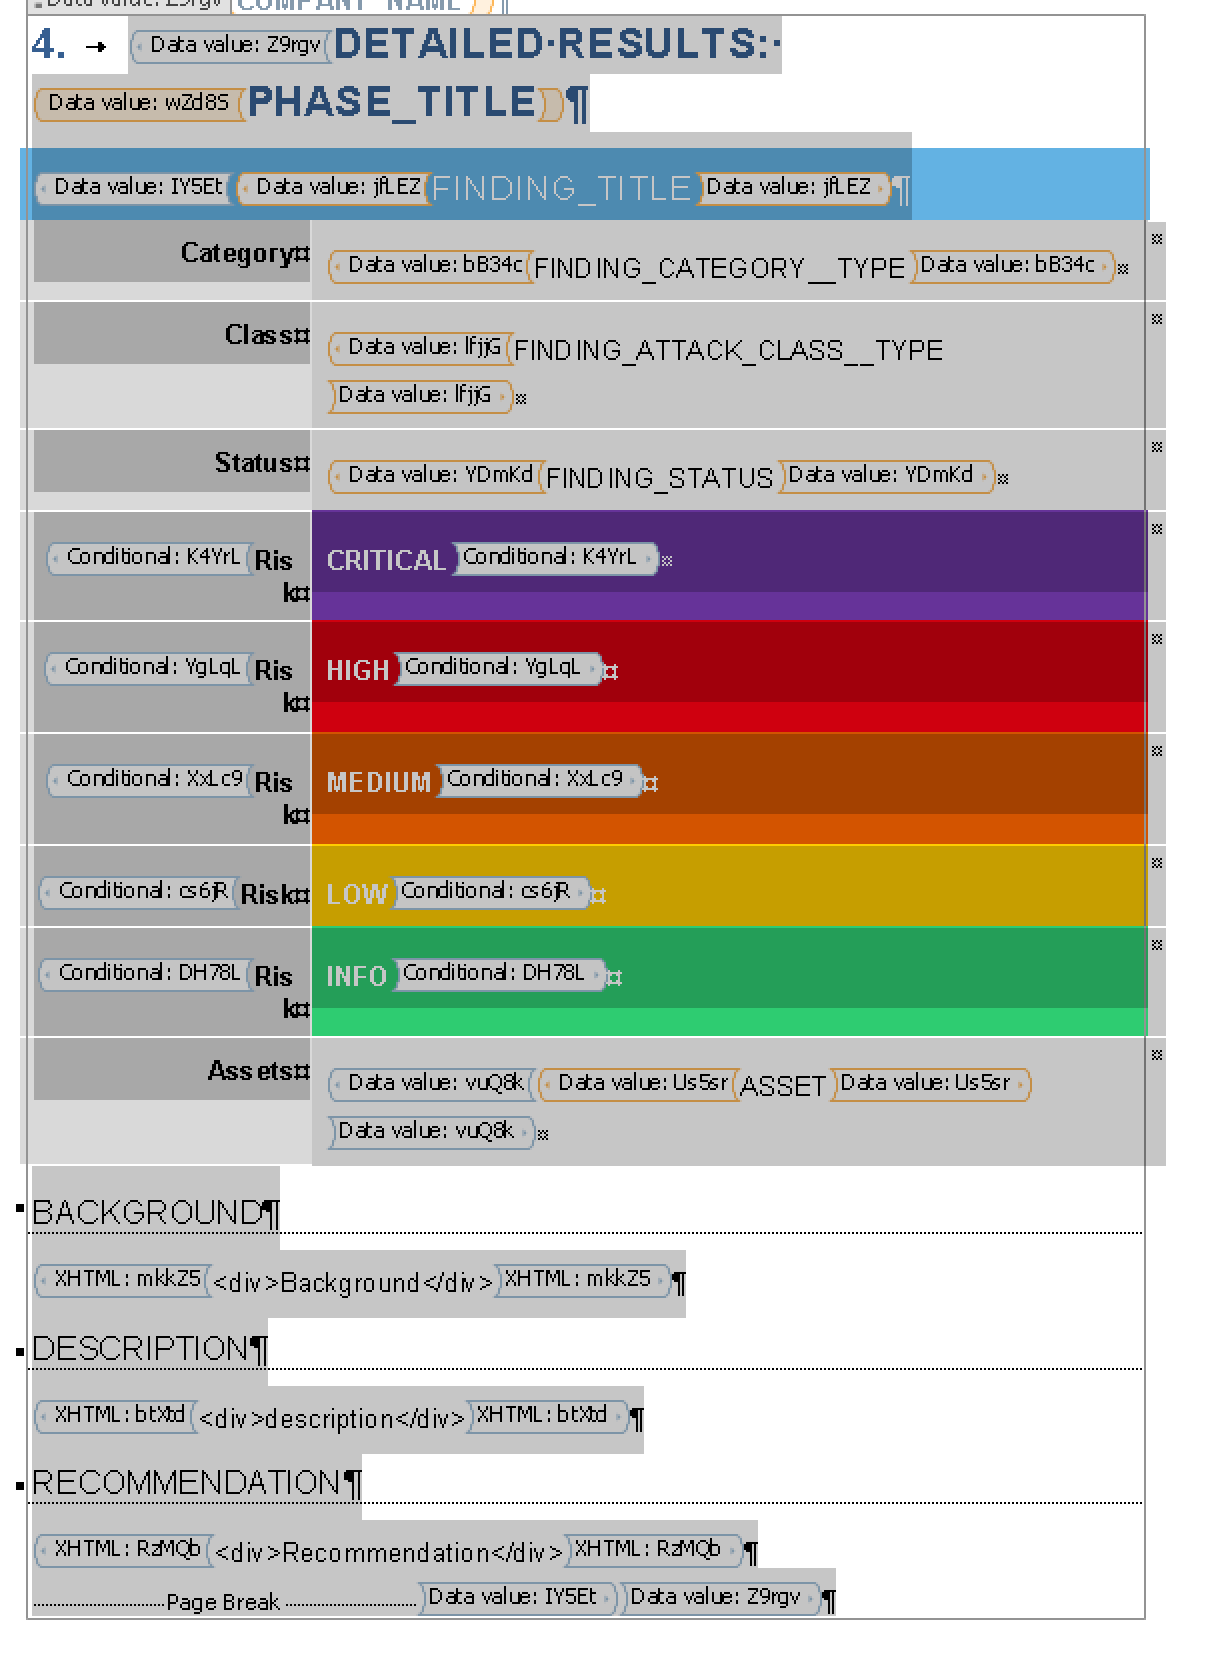
The above screenshot has an example of a mix of configurations including simple data fields, conditionals (for the table colour selection based on the rating) and repeats (around the asset, around the finding table block itself and around the entire section 4 to repeat for multiple phases, if available).
To achieve this:
Insert the main header, the style table block and the sub-headers as you would in a normal Word document.
Map the individual data points first. E.g. to insert the finding title in the header of the table block, place the cursor in that section and right-click and select Insert content control (for the standard data field).
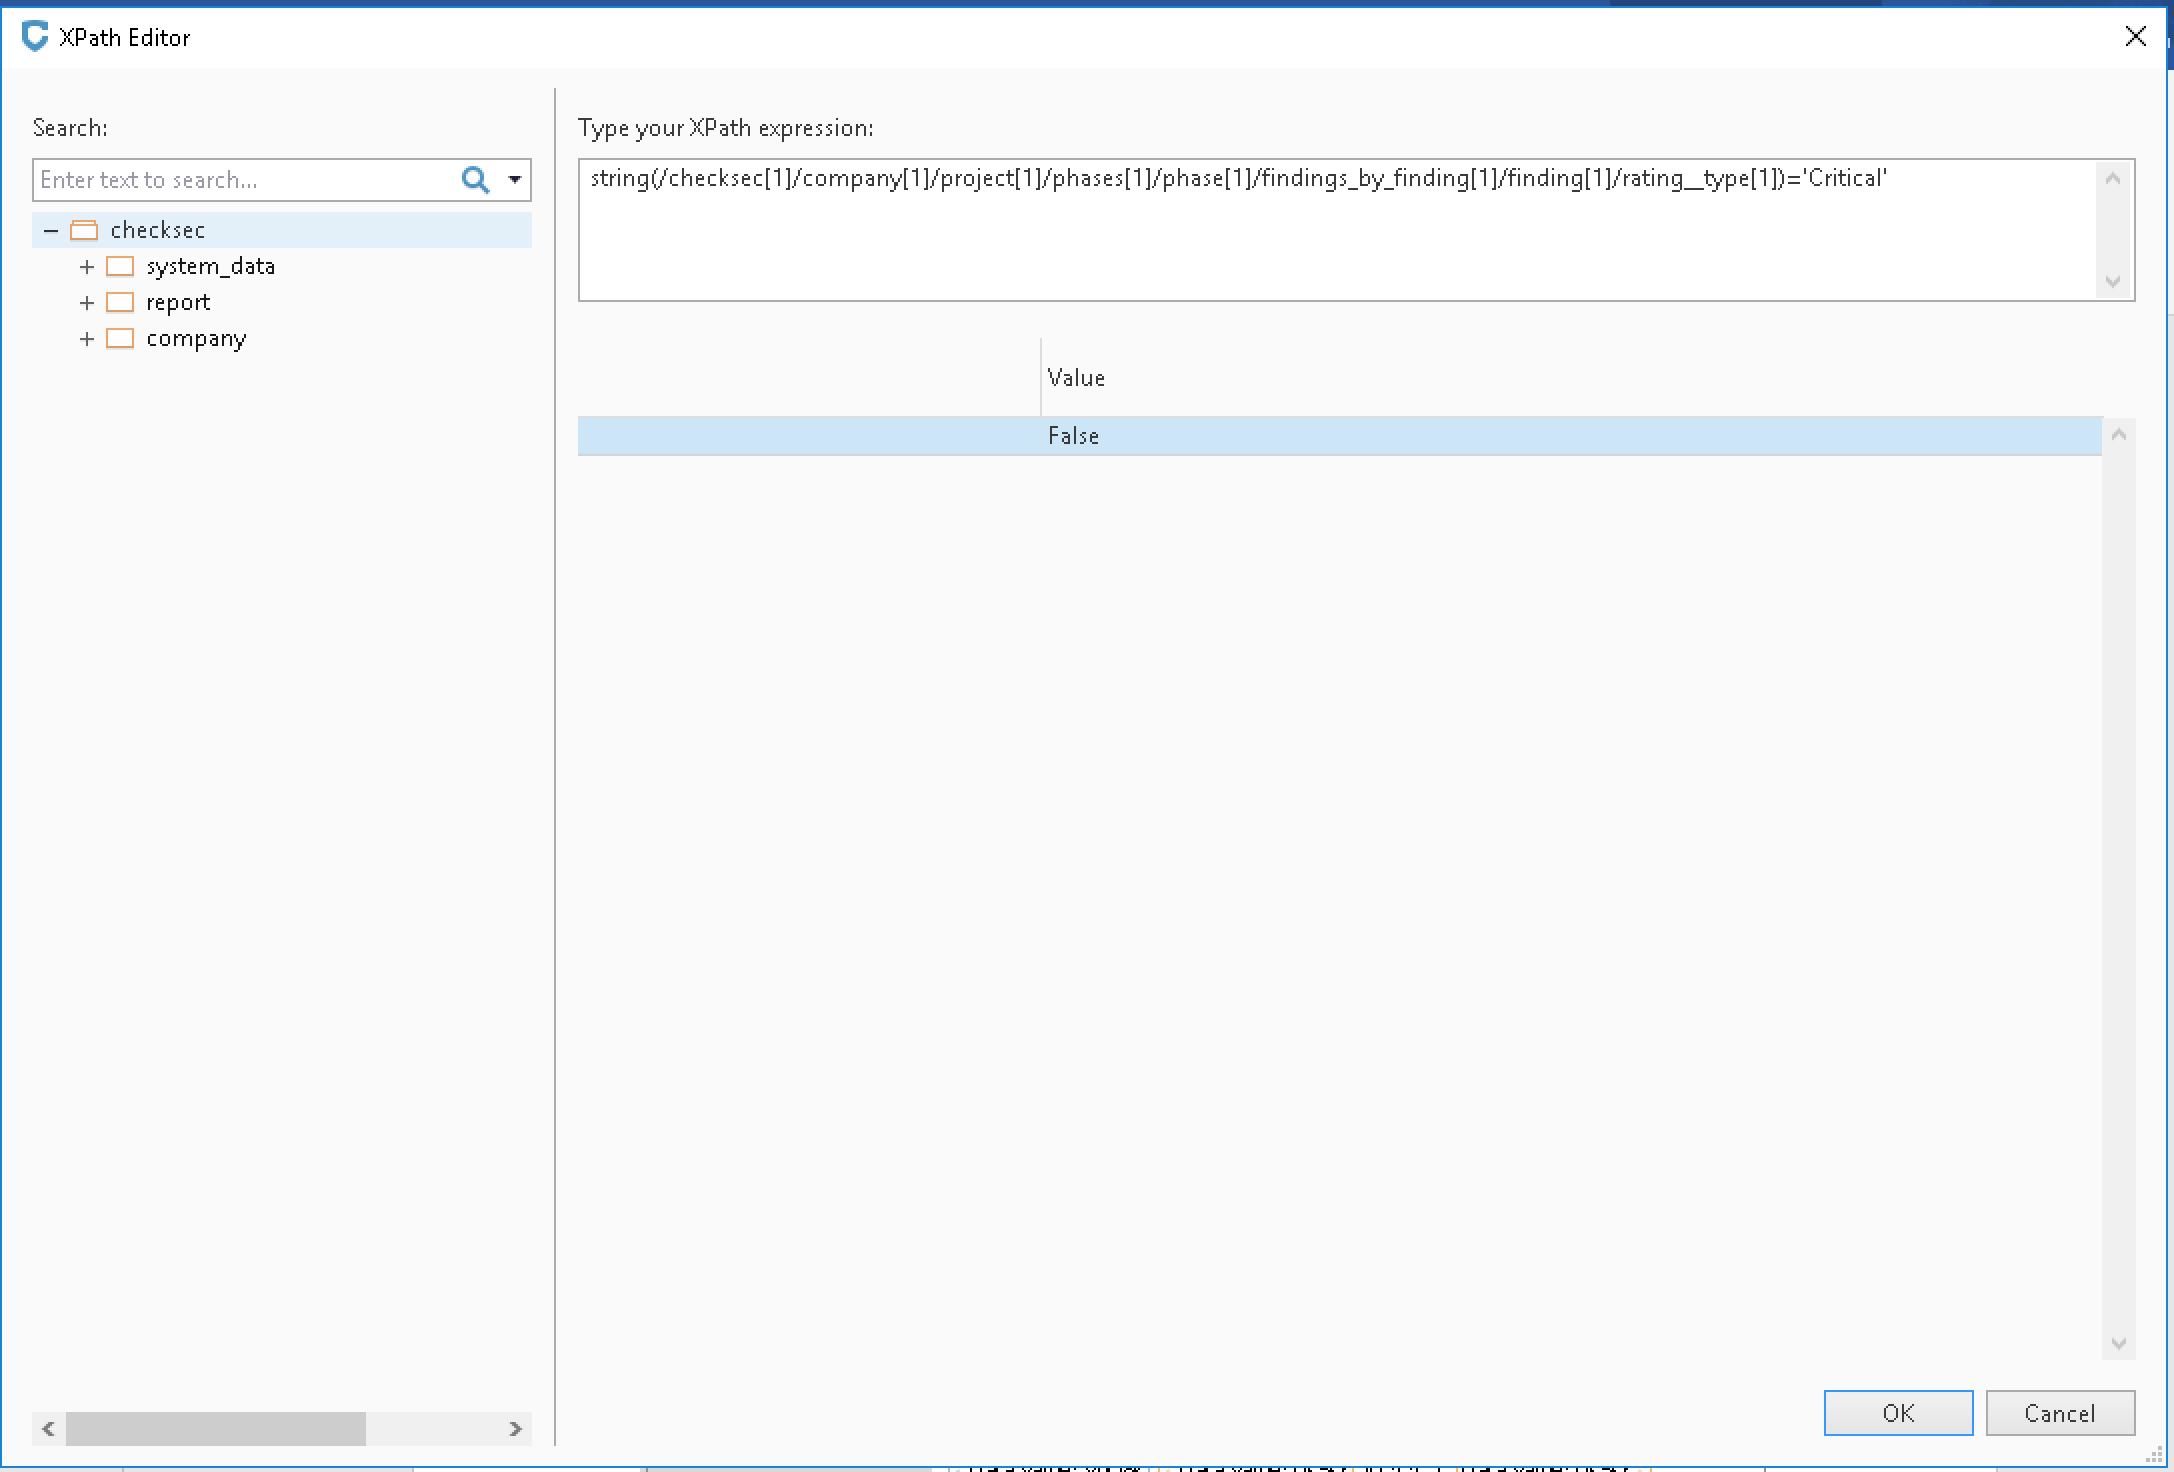
For the table rows that are coloured, select the row using the mouse and add a conditional (right-click, select Insert Condition content control). From the example above, the condition used is checking that the
rating__typeis the required value. The XPath used is:string(/checksec[1]/company[1]/project[1]/phases[1]/phase[1]/findings_by_finding[1]/finding[1]/rating__type[1])='Critical'
Once all of the fields and conditionals are mapped, the repeat can then be added. Using the mouse, select the finding block and then right-click and select Insert Repeat content control. This will add a repeat tag around the entire block.
This can then be repeated for the phase, following the same approach.
A short video is available to show you how to use the Canopy mapping plugin:
Conditionals
Conditionals are very powerful, but require some experience with XPath. The table below provides some common use cases for conditionals.
Example requirement |
Sample XPath |
|---|---|
Check if a finding is rated as Critical. |
Either of the following options will work: string(/checksec[1]/company[1]/project[1]/phases[1]/phase[1]/findings_by_finding[1]/finding[1]/rating__type[1])='Critical'
/checksec[1]/company[1]/project[1]/phases[1]/phase[1]/findings_by_finding[1]/finding[1]/rating__type[1]='Critical'
|
Check if any of the findings have a CVSS3 score in a certain range. For example, you might want to output a specific block based on whether there are CVSS3 scores in any finding that are rated as High (qualitatively speaking). |
count(/checksec[1]/company[1]/project[1]/phases[1]/phase[1]/findings_by_finding[1]/finding[cvss3_score >= 7.0 and cvss3_score < 10.0])>0
|
Check if there is a CVSS3 score defined using a boolean check as to whether a node value is set. |
boolean(/checksec[1]/company[1]/project[1]/phases[1]/phase[1]/findings_by_finding[1]/finding[node()])
|
Styling content controls in Word
There are two main types of styling Word considers: run level and block level. Runs are typically simple data points or a single paragraph. These can be styled in the Word document as normal. For example, if a finding title is inserted, this can be styled and the styling will be retained during report generation:

However, when considering blocks and styling, Word needs to be told what style to apply for the base styling. The block content can then influence the styling. Our block controls are the XHTML fields inserted into the Word document (i.e. wrapped with XHTML label and containing <div>Field name</div> content placeholders). These fields must be configured to use a specific base style when something other than Normal is required. This can be done by using the right-click context menu and selecting the appropriate style from the XHTML Styles option:
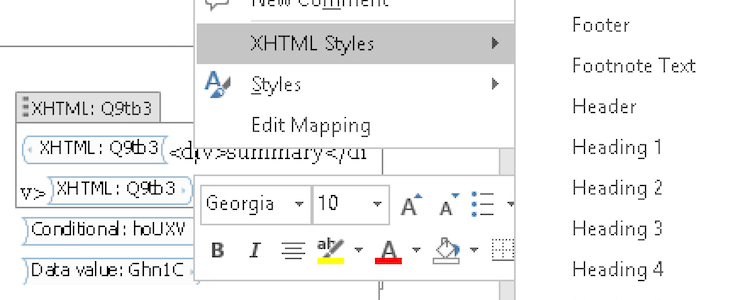
If you want a custom style to appear in this list, you must ensure its Style type (in the Style create/edit dialogue) is set to Linked (paragraph and character).
Working with charts
Canopy supports Microsoft Word charts natively. This means that any chart you can build in Word, you can have an associated plugin to generate the chart data to populate it. This gives you lots of flexibility to be able to display data. Some example chart implementations that are available include:
Risk summary (bar, column, pie)
Risk summary per phase (bar, column, pie)
Risk breakdown by category (bar, column, pie)
Risk breakdown by OWASP Top 10 failure (spider)
And so on. Access to the default chart set is available on request (chart plugins). We can also help you build chart plugins, as required. Please open a support ticket via https://support.checksec.com if you have any questions regarding this.
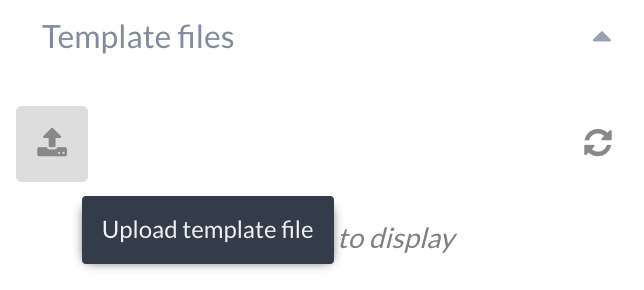
Uploading Word templates
When the Word template is set up to include the data points that should be populated from Canopy, it then needs to be uploaded to Canopy so other users can use it for report generation.
To upload a newly mapped Word template, or an updated Word template, follow these steps:
Navigate to the Template → Reports section.
Open the report template that the Word template is to be associated with.
Note
If you have updated a Word template, there’s no need to create a new report template, simply upload the updated template to the existing report template.
Click on the upload icon:
The following window is presented which allows for the setting of defaults and other information:
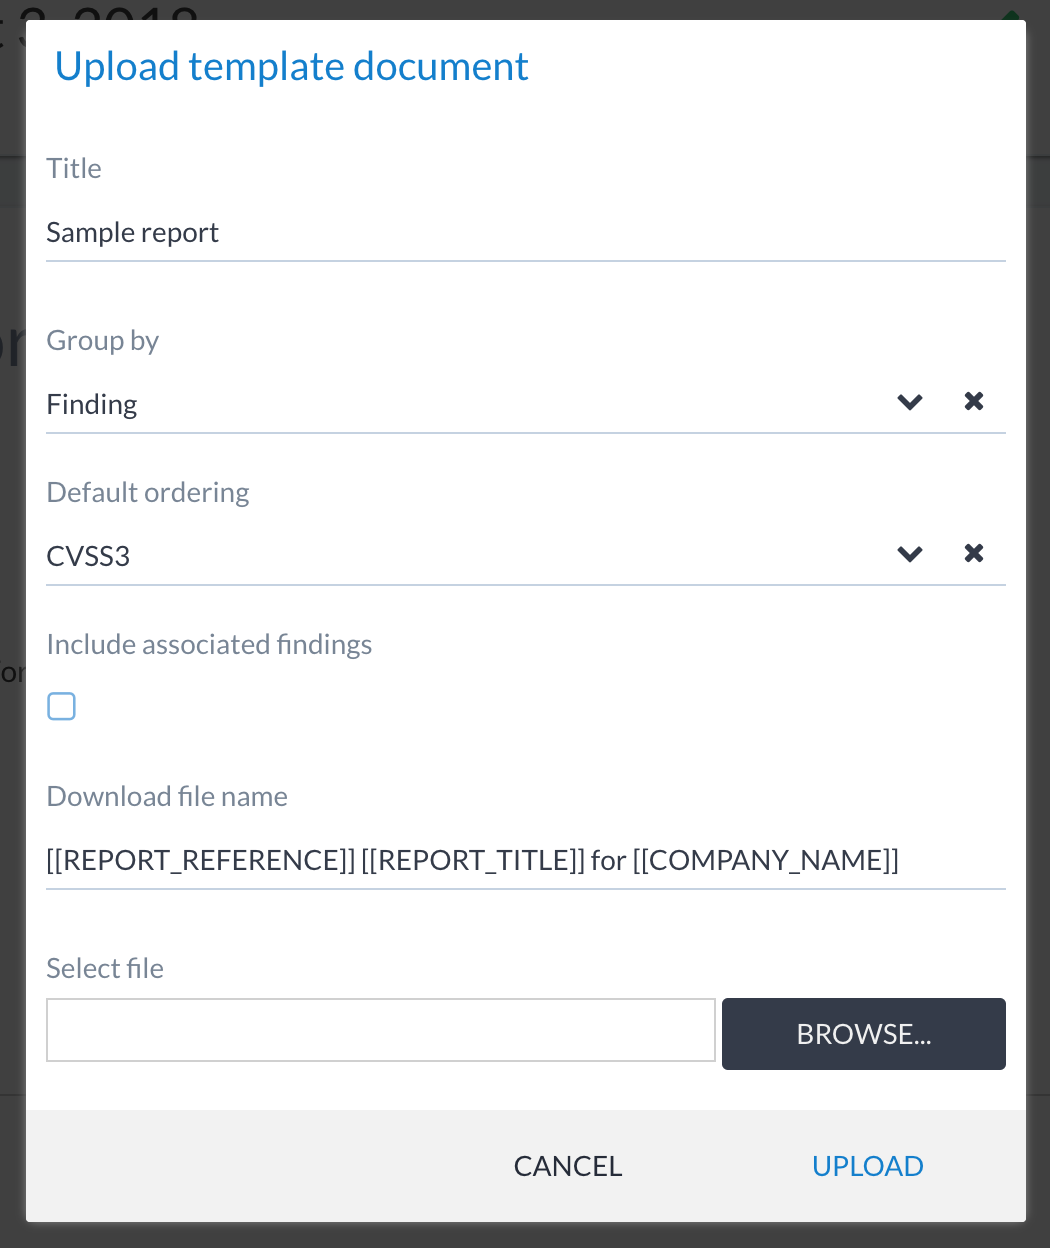
The fields are as follows:
- Title
The name of the Word template that will be visible to users when select them for reporting. Users may use this to also distinguish between versions or special adaptations.
E.g. Sample Report v3 - Large Data Report
- Group by
The way findings are grouped. This should match the section of the XML Mapping Document where findings/assets/etc. data points are added from. If you map the finding data points (
title,rating_type,cvss3_score, etc.) from../phase/findings_by_finding/finding, then you should select Group by: Finding. If combining multiple sections in one report, select the All option.- Default ordering
This is used to set the default ordering of findings in a generated report.
- Include associated findings
This includes associated findings (i.e. members of a finding group). These may be useful when generating large vulnerability assessment reports, where the group member details needs to be included in sections (e.g. an appendix listing all individual vulnerabilities of a missing Microsoft patch finding).
- Download file name
This is a name template for setting dynamic names on generated files. For example
[[REPORT_REFERENCE]] [[REPORT_TITLE]] for
[[COMPANY_NAME]]
. The dynamic values are taken from the substitution variables list.- Select file
This is used to select the Word template for uploading.
Note
Selecting this overwrites the Download file name field with the selected file name.