Reports
Note
The reports interface has been redesigned in Canopy 3.9.0. The redesign provides users with more flexibility when working on reports, as well as improved commenting feedback.
The Reports view is where users can work on report-level content. It is also the principle view for performing QA on reported content (the report, findings, phases and the project).
Each project can have zero or many reports. Different report templates can be used, which is helpful when you want to have different reports for different use cases. For example, you might create an interim report that includes details from findings, but no executive summary etc. And you might have a high-level exec-only report template. Canopy provides you with many options to meet your project’s reporting requirements.
Reports can also be linked to one or many phases. This allows you to have single-phase reports or multi-phase reports.
Pre-requisites: report templates
Before you can create a report, you need a report template. For further information on creating report templates, see Report templates.
Access controls
Access to reports is managed by the project and phases. The following access control decisions are made when accessing reports:
Canopy Section |
Role |
Report access granted |
|---|---|---|
Project |
Admin |
Access to view, add, edit and delete all reports in the project. |
Project |
Write |
Access to view, add, edit and delete all reports in the project. |
Project |
Read |
Access to view all reports in the project. |
Phase |
Admin |
Access to view, edit and delete all reports that the user has access to. |
Phase |
Write |
Access to view, edit and delete all reports that the user has access to. |
Phase |
Read |
Access to view all reports that the user has access to. |
Note
Once a user has some form of access on a report, they are allowed to comment on report fields. However, their visibility of certain fields may be limited. For example, if a user has access to a phase that’s included in a report, but does not have access to the project, they will not be able to view the project’s fields.
The following sections of this document assume you have the adequate permissions on a report. If you do not, and you require access, please contact your Canopy Administrator.
Creating a report
In order to create a report, go to the project you want to create a report in. Click on the reports tab.
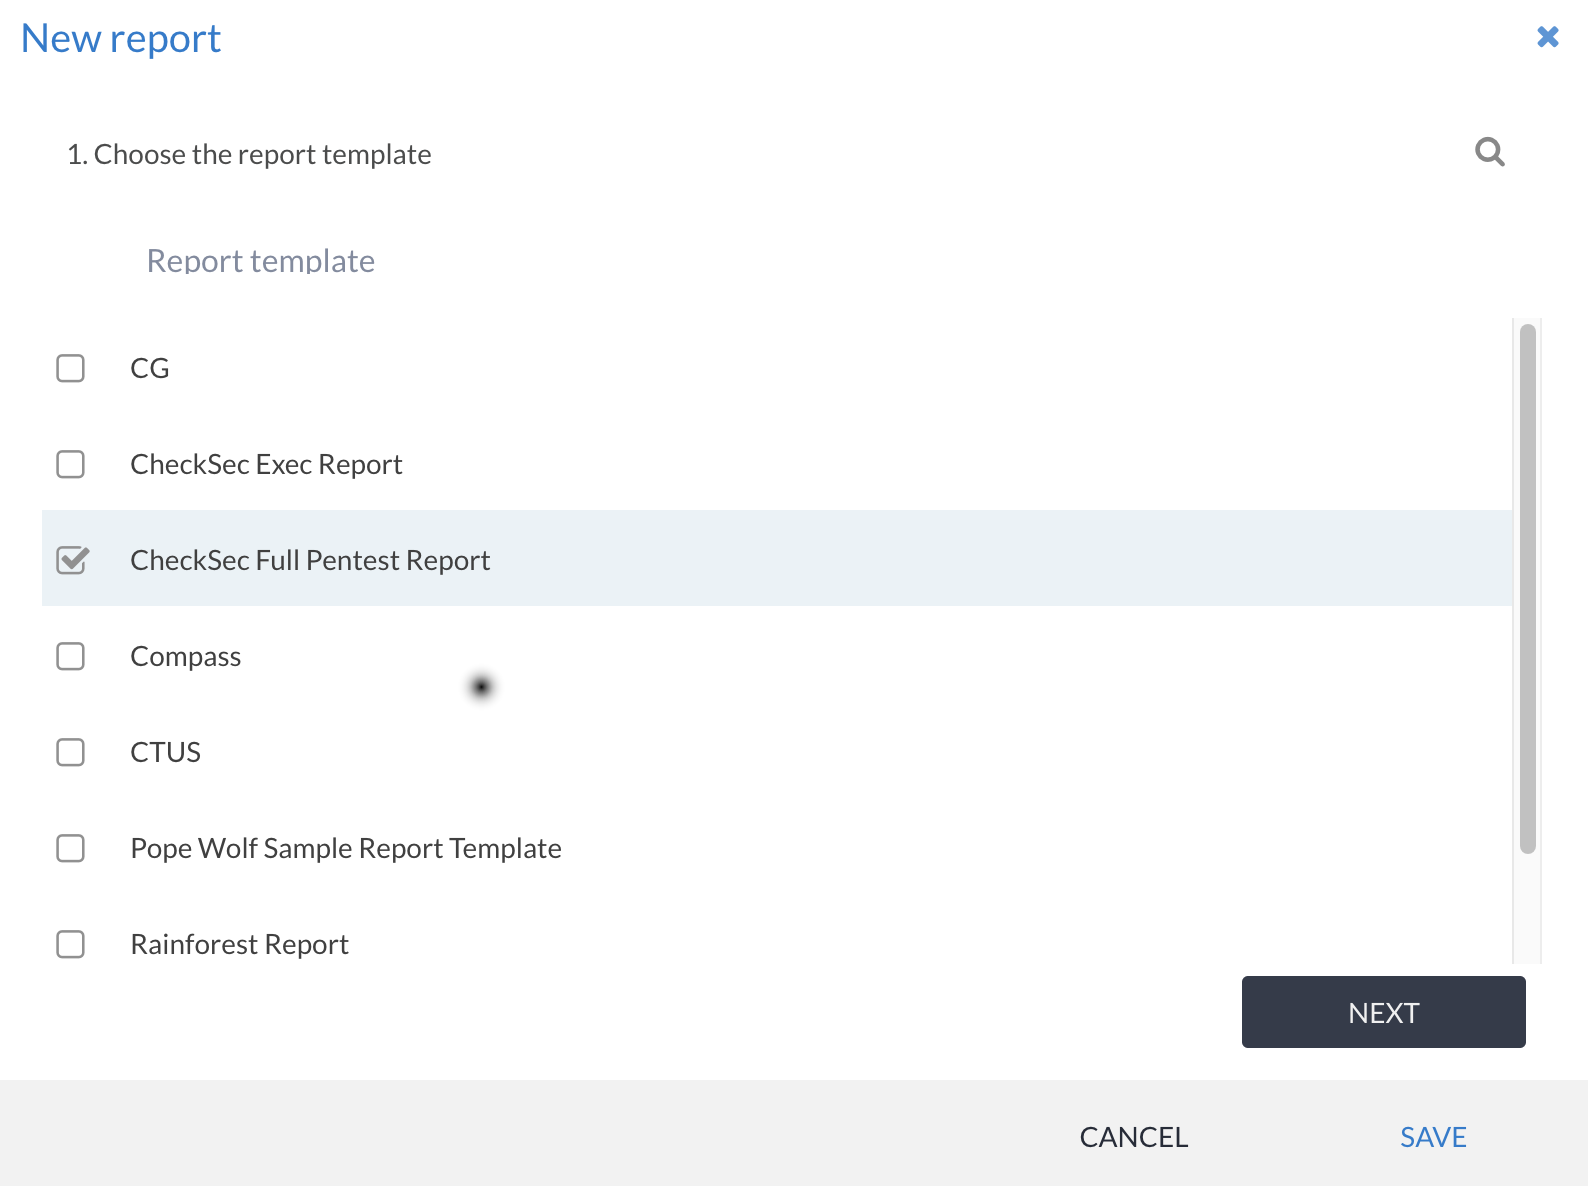
Clicking on the + REPORT button will bring up the Add Report Wizard. The first step is to select the desired Report Template:
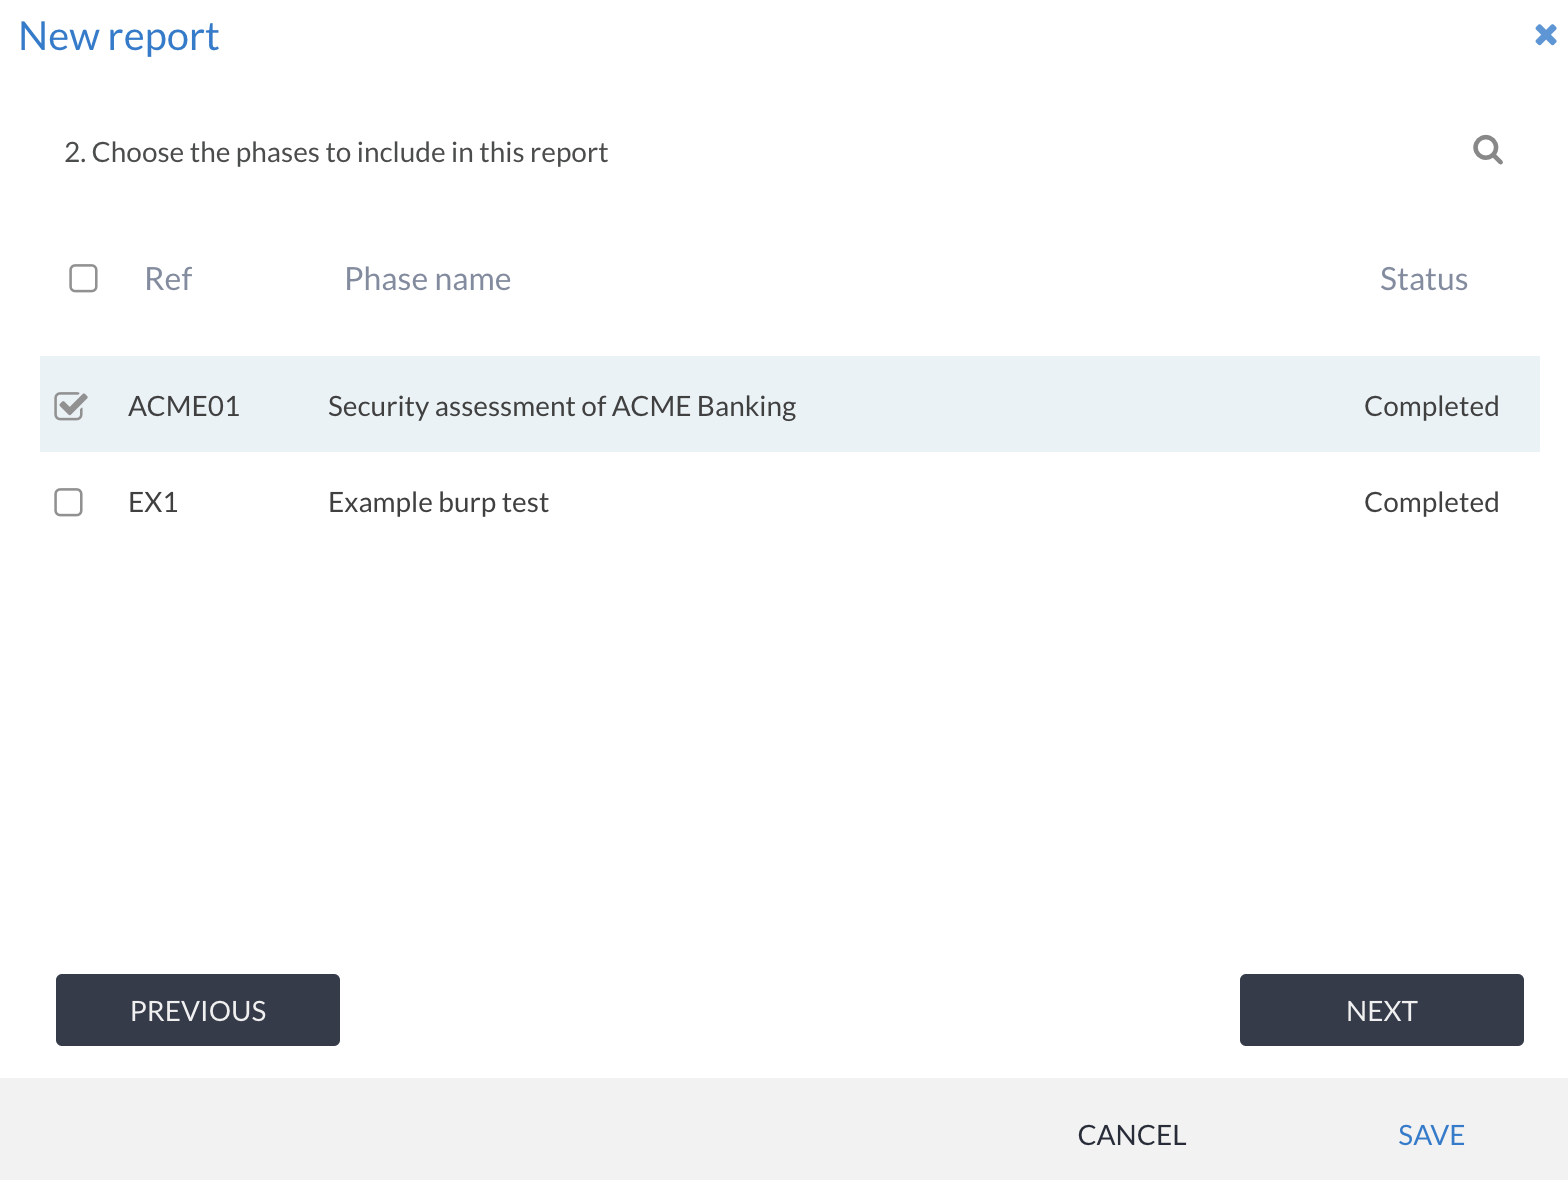
Once you have chosen a report template, the next screen will ask you to choose which phases you want to link to the report. You can include any phase at this stage. The purpose of selecting one or many phases to to allow for multi-phase reports:
Note
From Canopy 3.9.0 you can add and remove phases to an existing report as required. See below.
Once you have selected the phases, you can click NEXT and set the report’s properties, and then save. The report will be created and you will be taken to the main report view.
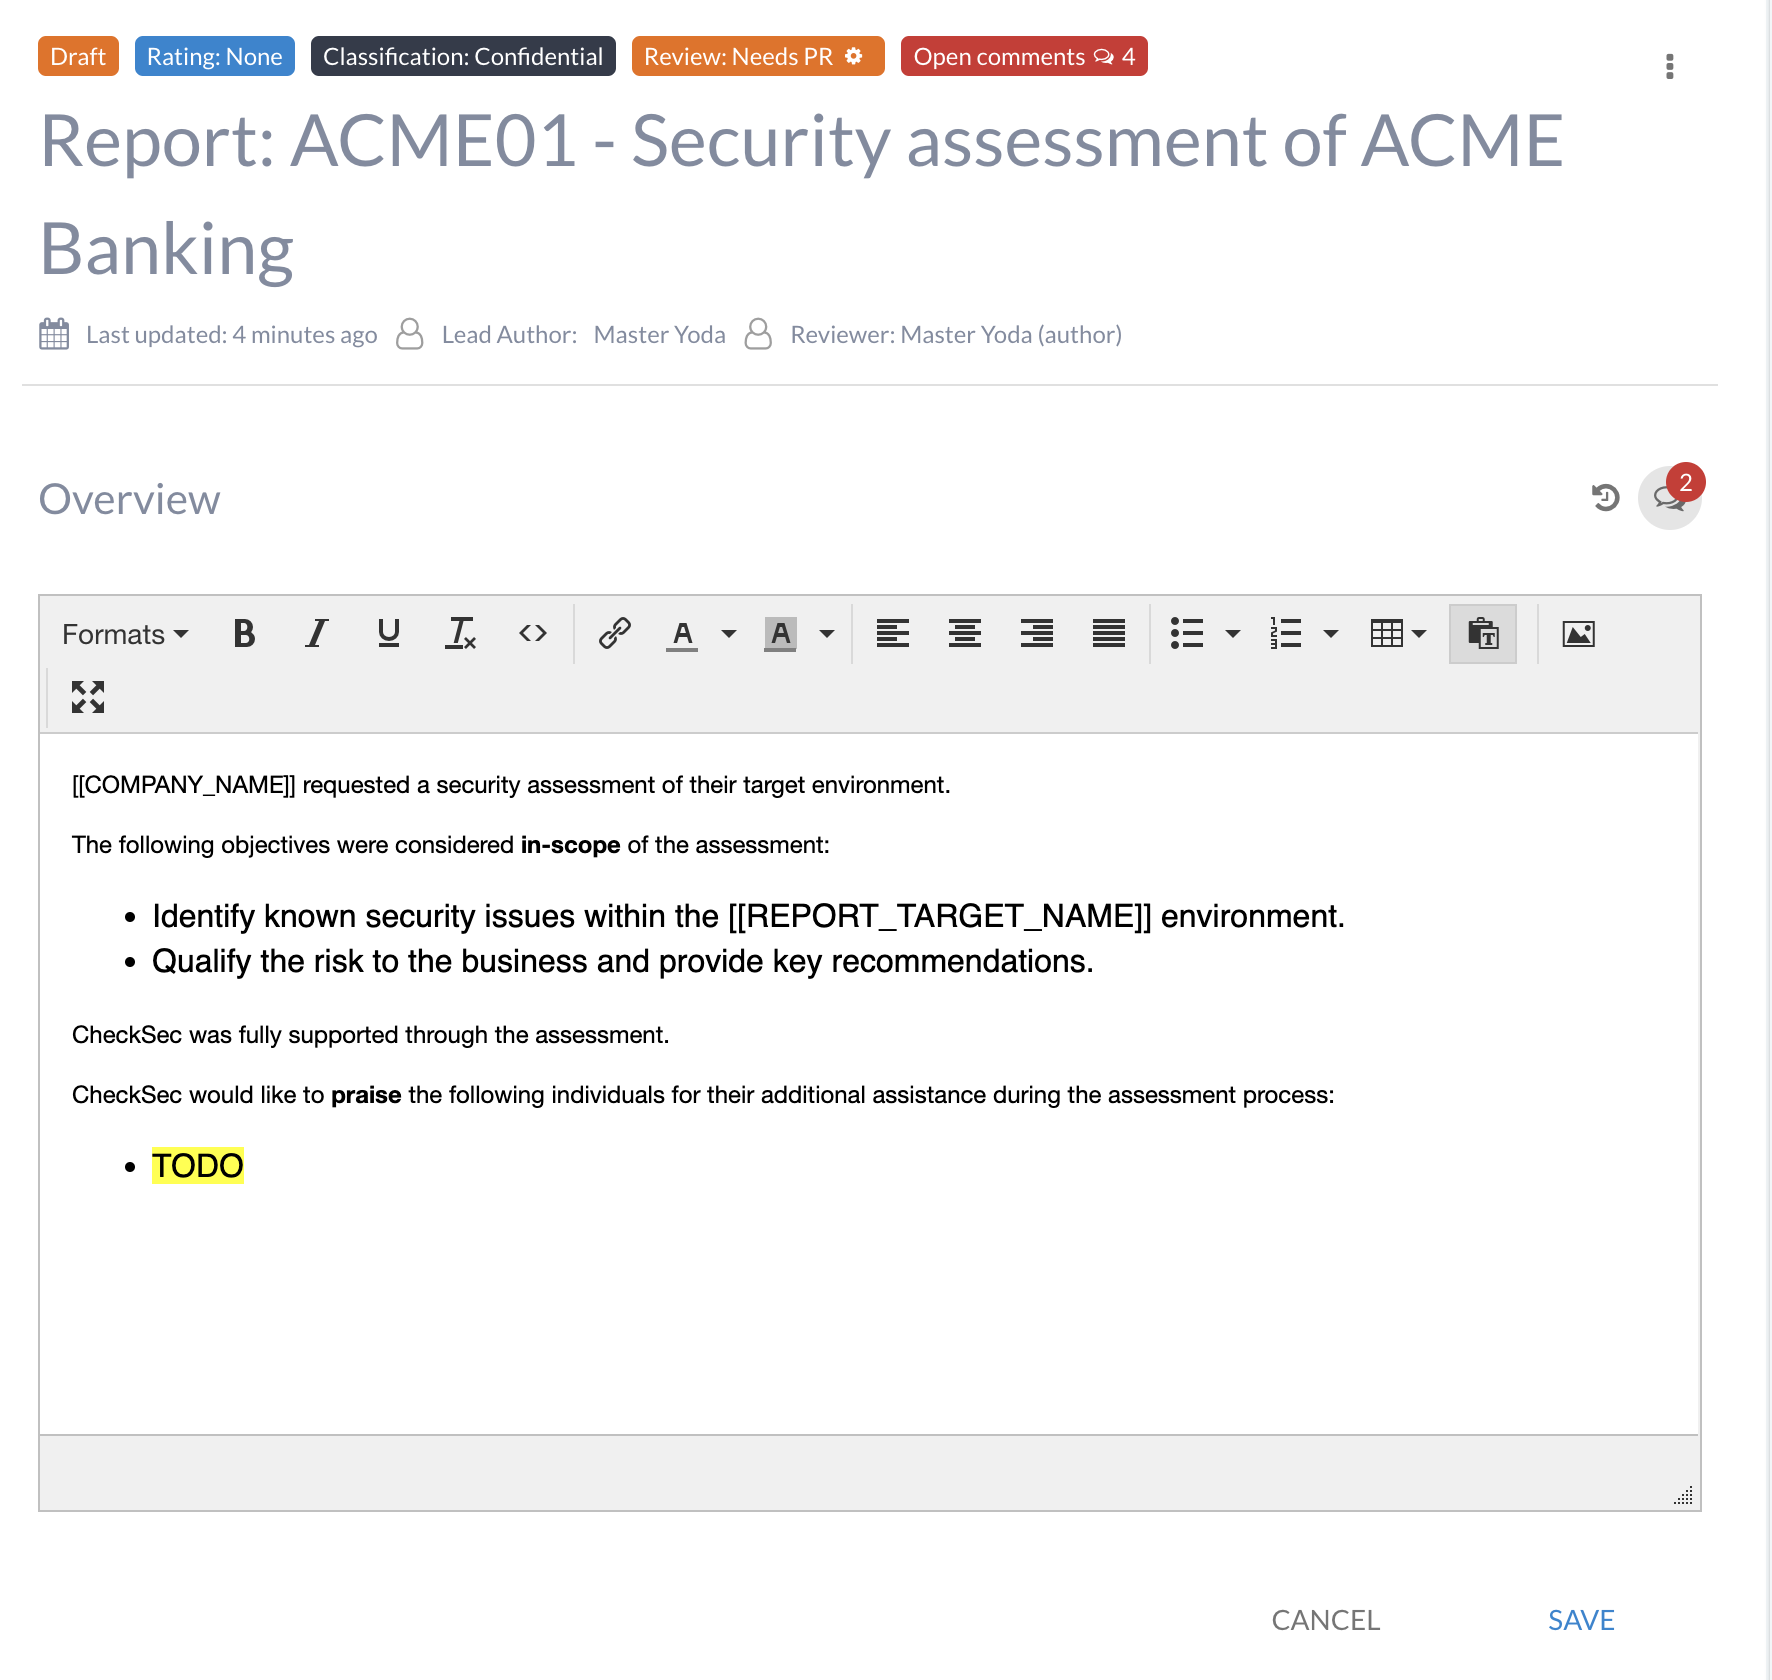
Report View: sections and fields
A report is made up of multiple sections. Some of these sections are user definable, during template set up. This might include section headers (e.g. that match a Word template, such as “Executive Summary”). Others might be built-in sections, such as the reports properties or included phases (which will show the phase properties and the findings associated with that phase).
For more information on the user-definable sections and fields during the template setup, see Report templates.
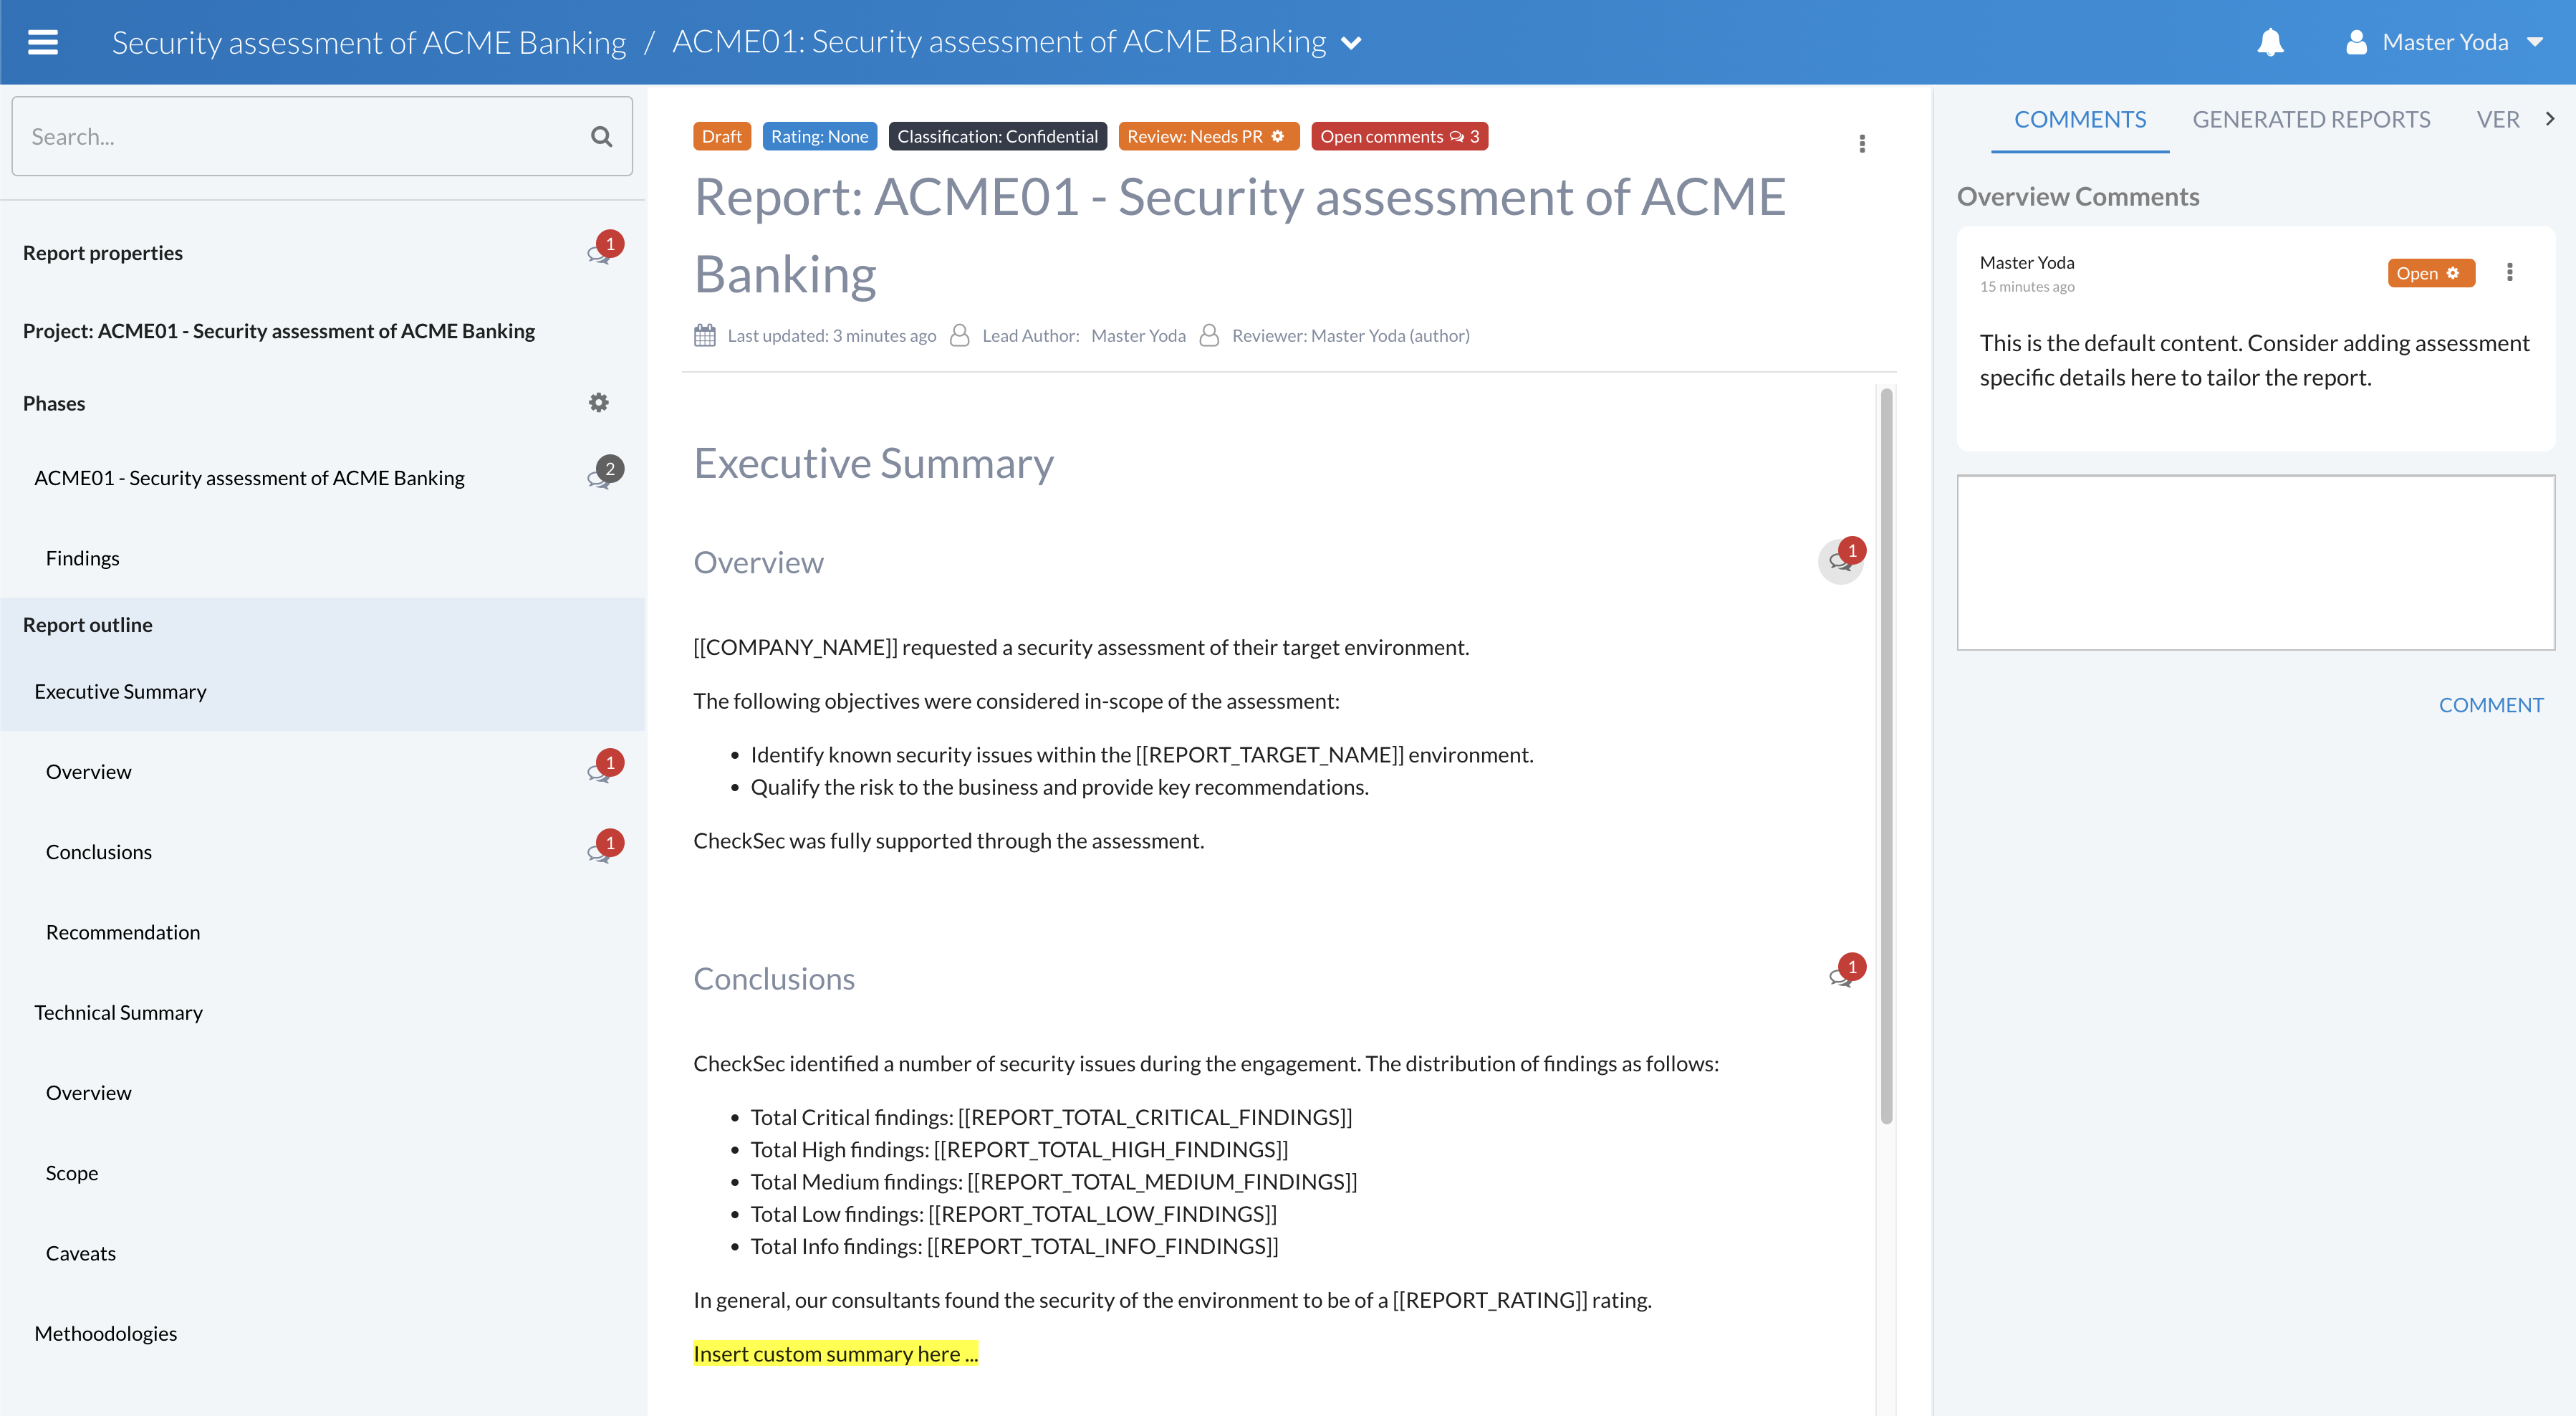
The report view provides access to:
Report properties: this includes the title, relevant dates, lead author, authors, reviewer lists and the distribution list.
Project properties: this includes the various fields, including custom fields, associated with the project that the report was created in.
Phases, phase properties and findings: a list of phases linked to the report and their properties. Findings from the phase are also listed for easy access during review.
Report outline and associated sections and headers: these are the user (template) defined sections of the report. They typically match to corresponding sections of a Word template.
Distribution list
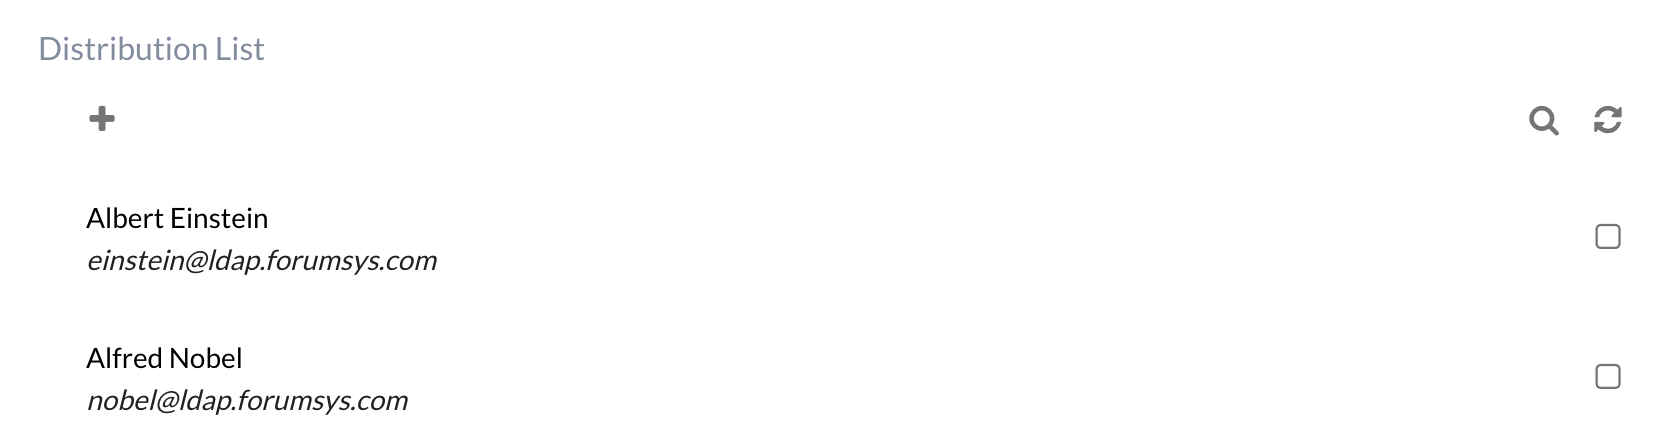
The distribution list (access on the reports properties) can be set with Contacts from Canopy. This is useful for sending out notifications to user in the distribution list. It can also be included in the generated reports (if mapped to the Word template). The distribution list is accessed via the report properties section of the report:
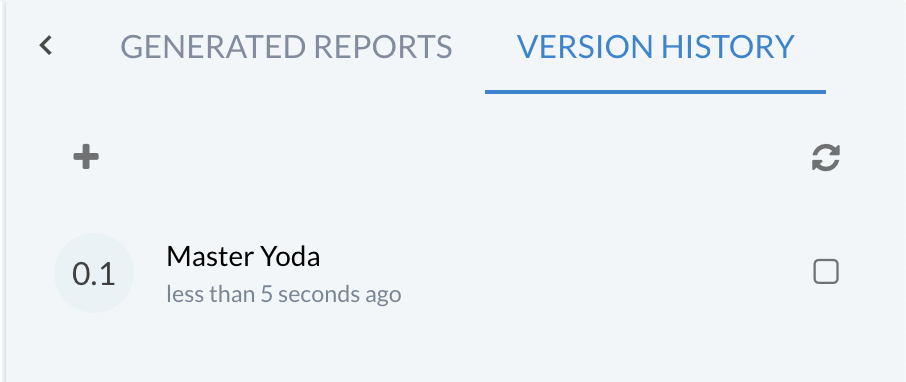
Version history table
Canopy provides a way of manually adding version history (or change history) entries for documents that require such data. This can be accessed via the tabs on the right side of the Report View.
Editing a report
All report fields can be edited via in-line editing - i.e single click on the field you want to edit. Fields will either be automatically saved on change, or when clicking the SAVE button (if shown for the field).
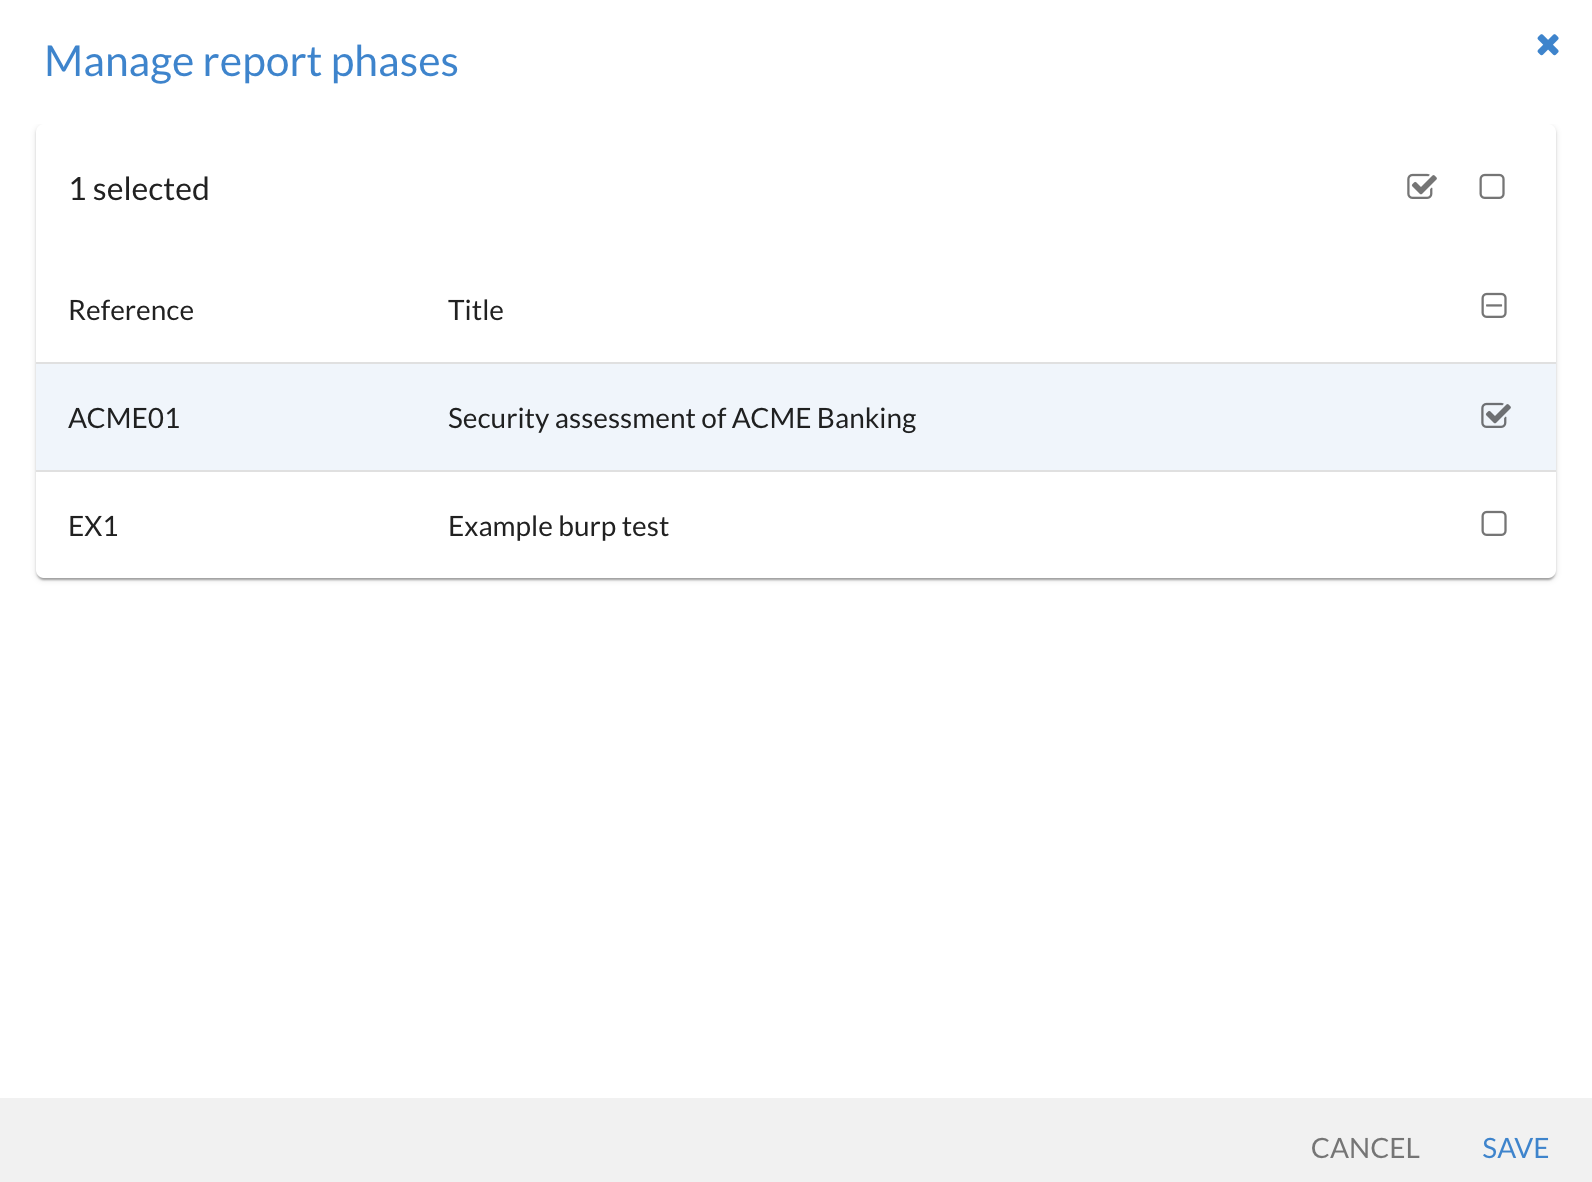
Adding and removing phases (New in 3.9.0)
You can add and remove phases from a report by clicking on the gear icon on the phases section. This will pop-up a window that allows you to select/deselect the phases that should be linked to the report:
Commenting and QA process
The Report View provides a single location for carrying out QA on your data before generating the final report.
Commenting
Comments can be added on any field in Report View via the comment icon. Comments can be added to sections, fields and findings. This allows for QA on the report’s properties, the project’s properties, phase properties, findings and other report fields.
Comments for a section are shown in the right-hand Comments tab:
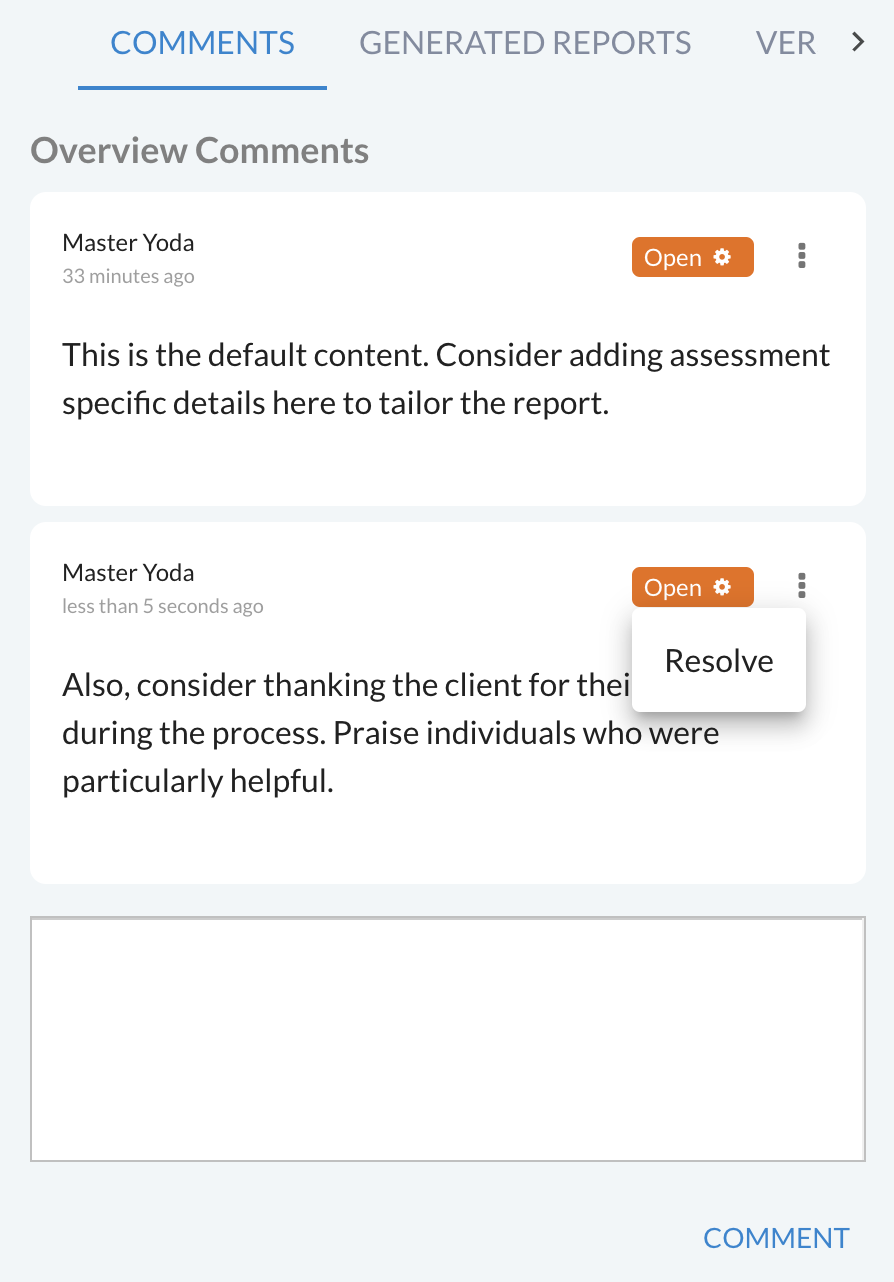
You can drill down on comments to the field level.
Comments can be transitioned from Open -> Resolved. You can also Reopen comments. All Open comments are shown with a red icon and a comment count. When a section or field has all comments resolved, a grey icon and resolved comment count is shown. This helps improve feedback of what QA has taken place.
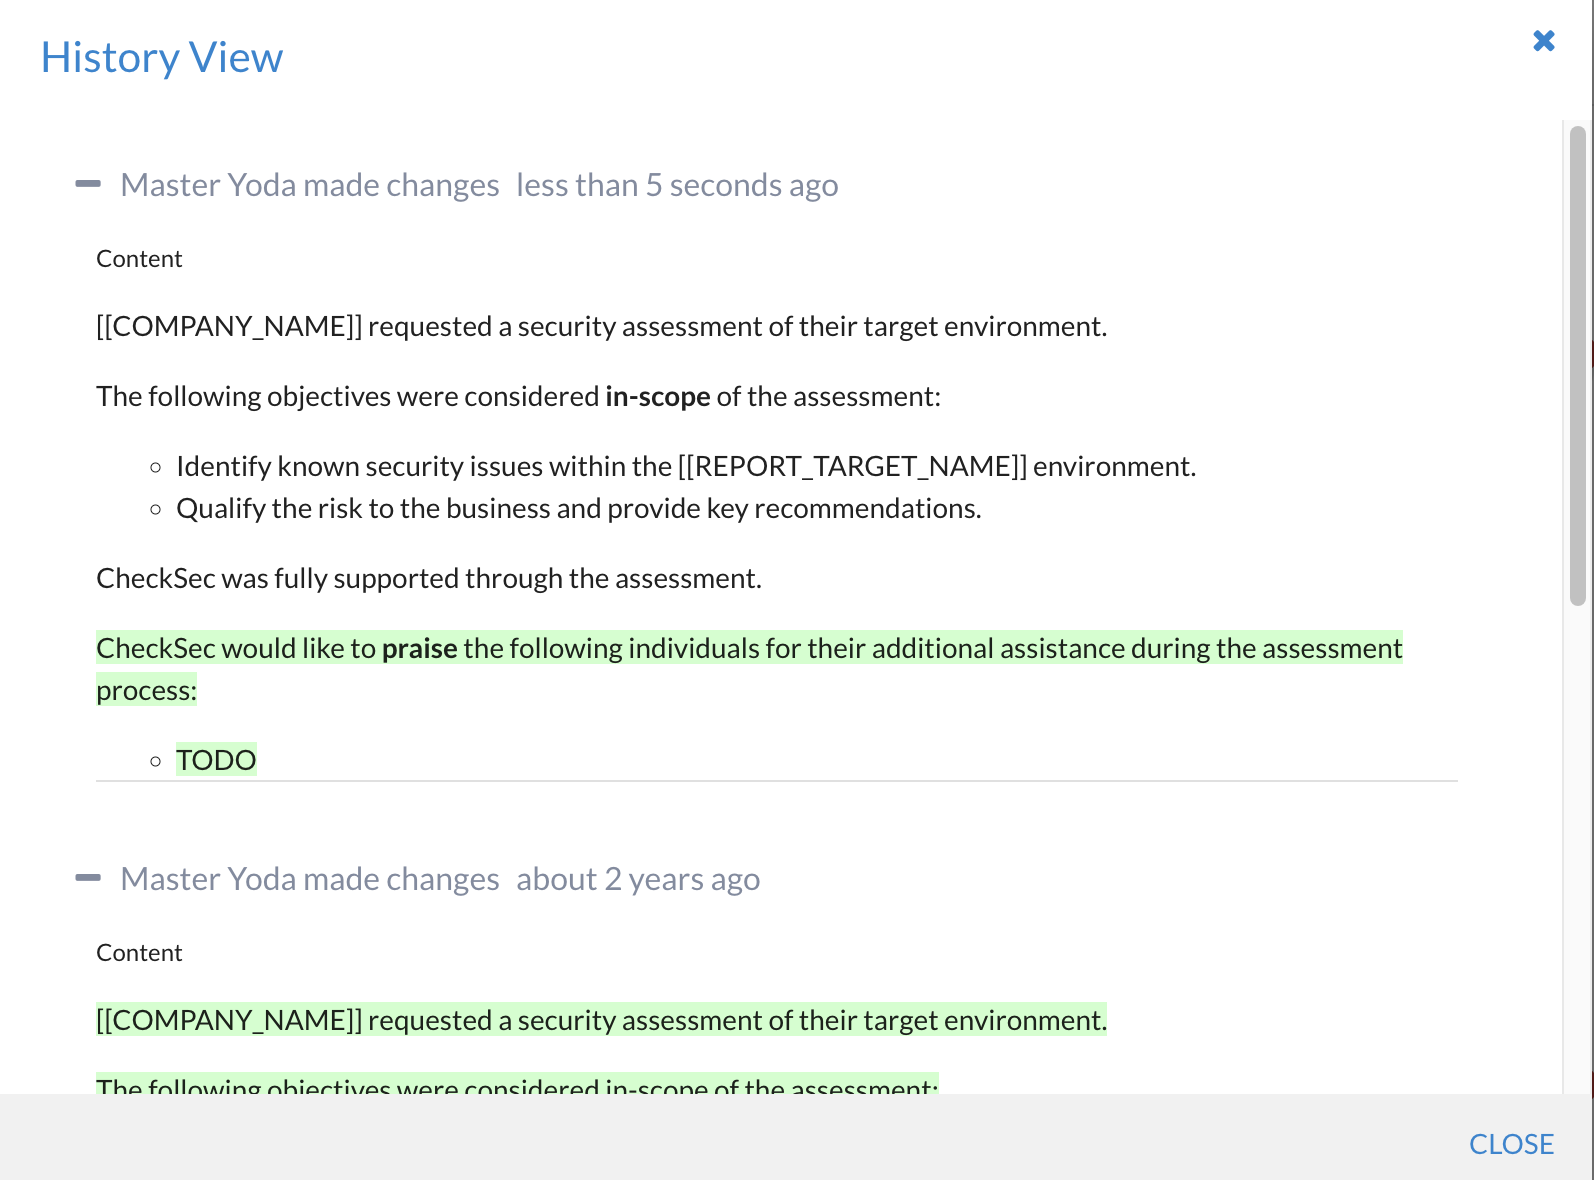
Change History
You can view the history of how certain fields (i.e. rich text fields) has changed over time. Wherever you see the history icon, you can click it and it will show you a list of changes (most recent first), and who made those changes and when. This can help greatly with the review
Note
Change history is also currently available on the Findings View.
Review Process
The review process in Canopy is broken down into two stages:
Technical peer-review (PR), and
Quality assurance (QA)
Note
This two-stage process is fixed at the moment and cannot be adjusted.
Reviewers can comment on the content, view changes to content over time and also indicate when a step is approved or if QA failed, and the QA process is rejected (and reset).
The owner of a report can cancel the review process at any time.
When a report transitions to a stage in the review workflow, the users who have been tagged as reviewers will be notified (via in-app notifications and via email - if enabled). Users can then accept the PR/QA request, which is assigned based on a first come, first serve (accept) basis. The report will appear on the user’s Dashboard and in their notifications (in-app/email), which will allow them to click through to the report to accept the invitation.
Note
Only one user can be assigned PR or QA access at a time. The PR and QA steps of the review workflow can be re-run multiple times with different users, if required.
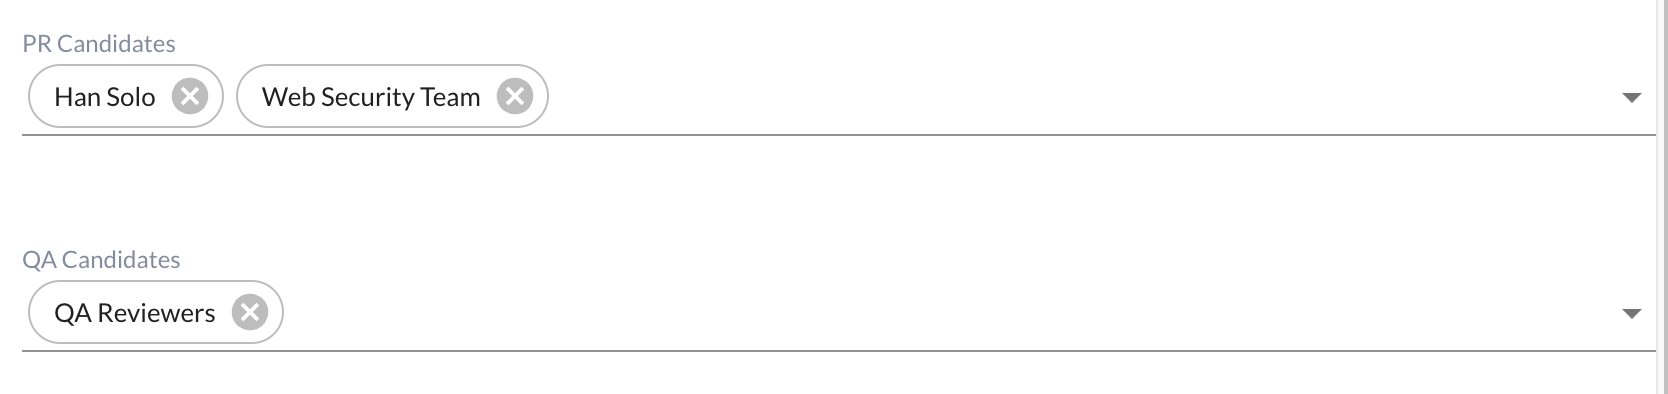
Setting the PR/QA Reviewers list
By default, the members of the global PR and QA roles are granted the permission to accept a PR/QA request. However, these lists can be overridden on the report properties phase, changing the following lists (which can contain groups and individual users):
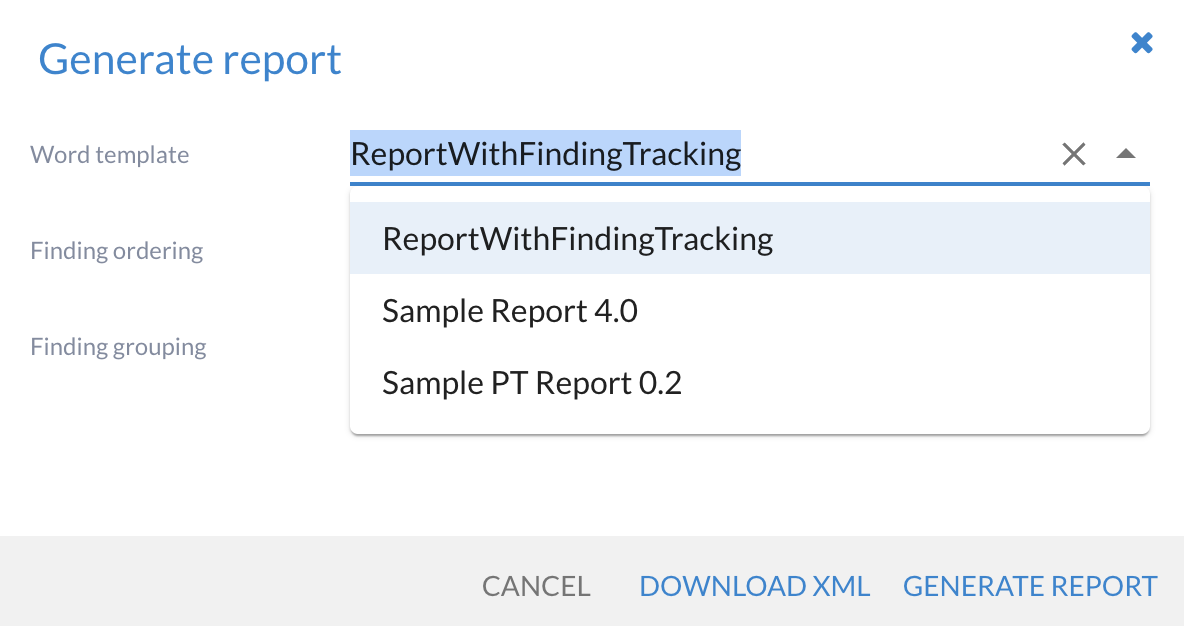
Generating a report
To generate a report, click on the Generated Reports tab in the Report View. Click on the play icon to generate a report. Default settings are chosen, which can be overridden:
Reports can be generated for preview purposes or for report delivery. Reports are generated in the following formats:
Word (docx user defined template)
PDF (converted from docx)
XLSX (xlsx user-defined template)
CSV (converted from xlsx)
XML (data dump for importing into downstream tools)
Clicking on the download icon of a generated report gives you the export options available.
See XLSX tool import for more information on importing XLSX tool data files.
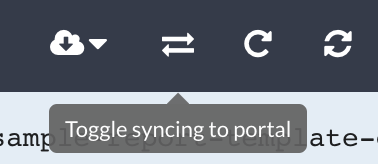
Synchronizing a report to the Canopy Portal (Premium/Enterprise Only)
If you are using the Canopy Portal, you can synchronize generated reports. This can be done by clicking on a generated report and selection the sync icon:
Reports are synchronized every 15 minutes. You may have to wait until the synchronization completes to view the report on the Canopy Portal.
Deleting a report
To delete a report, either go to the report list view on the project and select the reports you want to delete. Or within the report view, go to the Report Properties section and click on the kebab menu item (3 vertical dots) and click on DELETE and confirm.
Caution
This is a destructive action which cannot be undone. Deletion of a report will mean the report is no longer available.