Getting started
This is a quick tutorial for users who want to get up and running with Canopy as quickly as possible. For more background and extended detail on using Canopy, see the User guide.
What is Canopy?
Canopy is first a solution to help go from results to a report as quickly as possible. However, Canopy goes beyond this to help manage the entire delivery process around an engagement, which is useful for managing the non-technical aspects of assessments. For additional background information on Canopy, see About Canopy.
Canopy uses a number of terms which should be familiar to most users. For a quick overview of key concepts in Canopy, see Key concepts.
What’s required to go from zero to report?
First, some basics
Canopy’s user interface is built around Google’s Material Design concept. Our aim was to build a user interface on principles which are well thought out and, importantly, common to users. That means Canopy’s user interface doesn’t have to be “learnt”, it should be (mostly!) obvious. Of course, Canopy is a “power user” app, and some additional knowledge is required. But for typical functions of a web application, common patterns are followed.
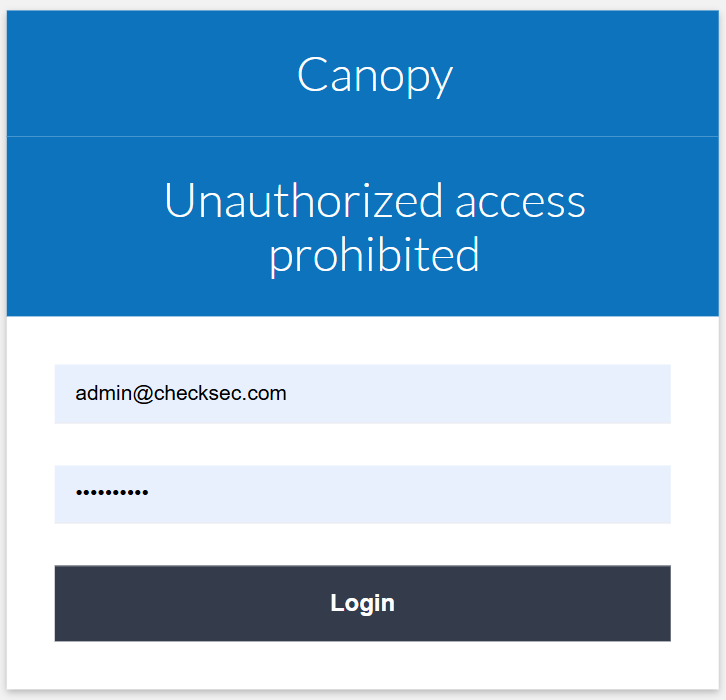
Logging in
User accounts in Canopy are linked to the user’s email address. The login panel accepts the username and password:
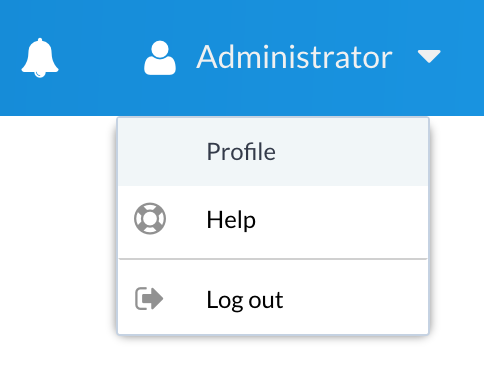
Logging out
In order to log out, click on the profile name and select Log out or via the main navigation menu (see below):
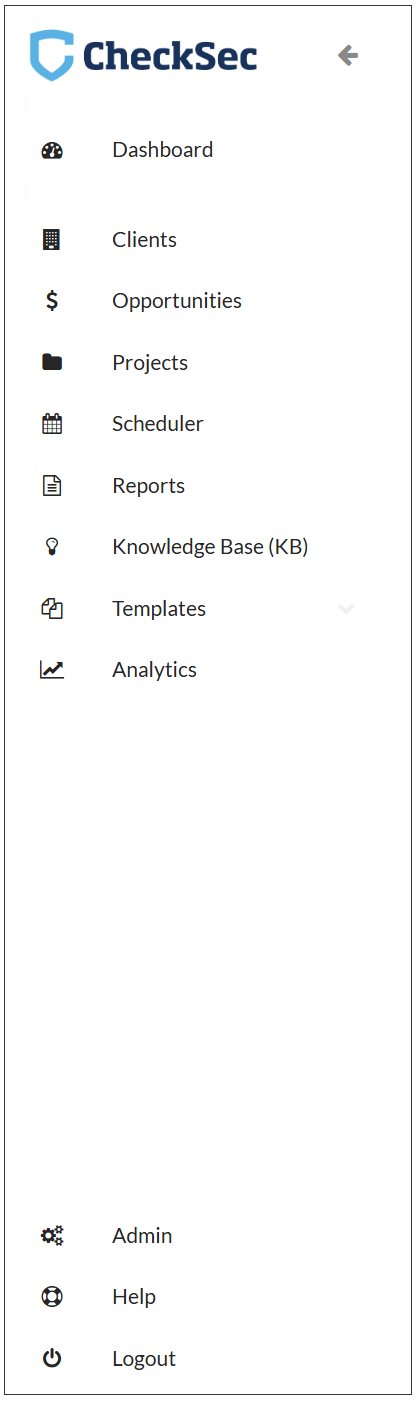
Navigation
The main navigation within Canopy is accessed using the hamburger icon
![]() in the top left corner of the screen.
in the top left corner of the screen.
This brings up the main menu:
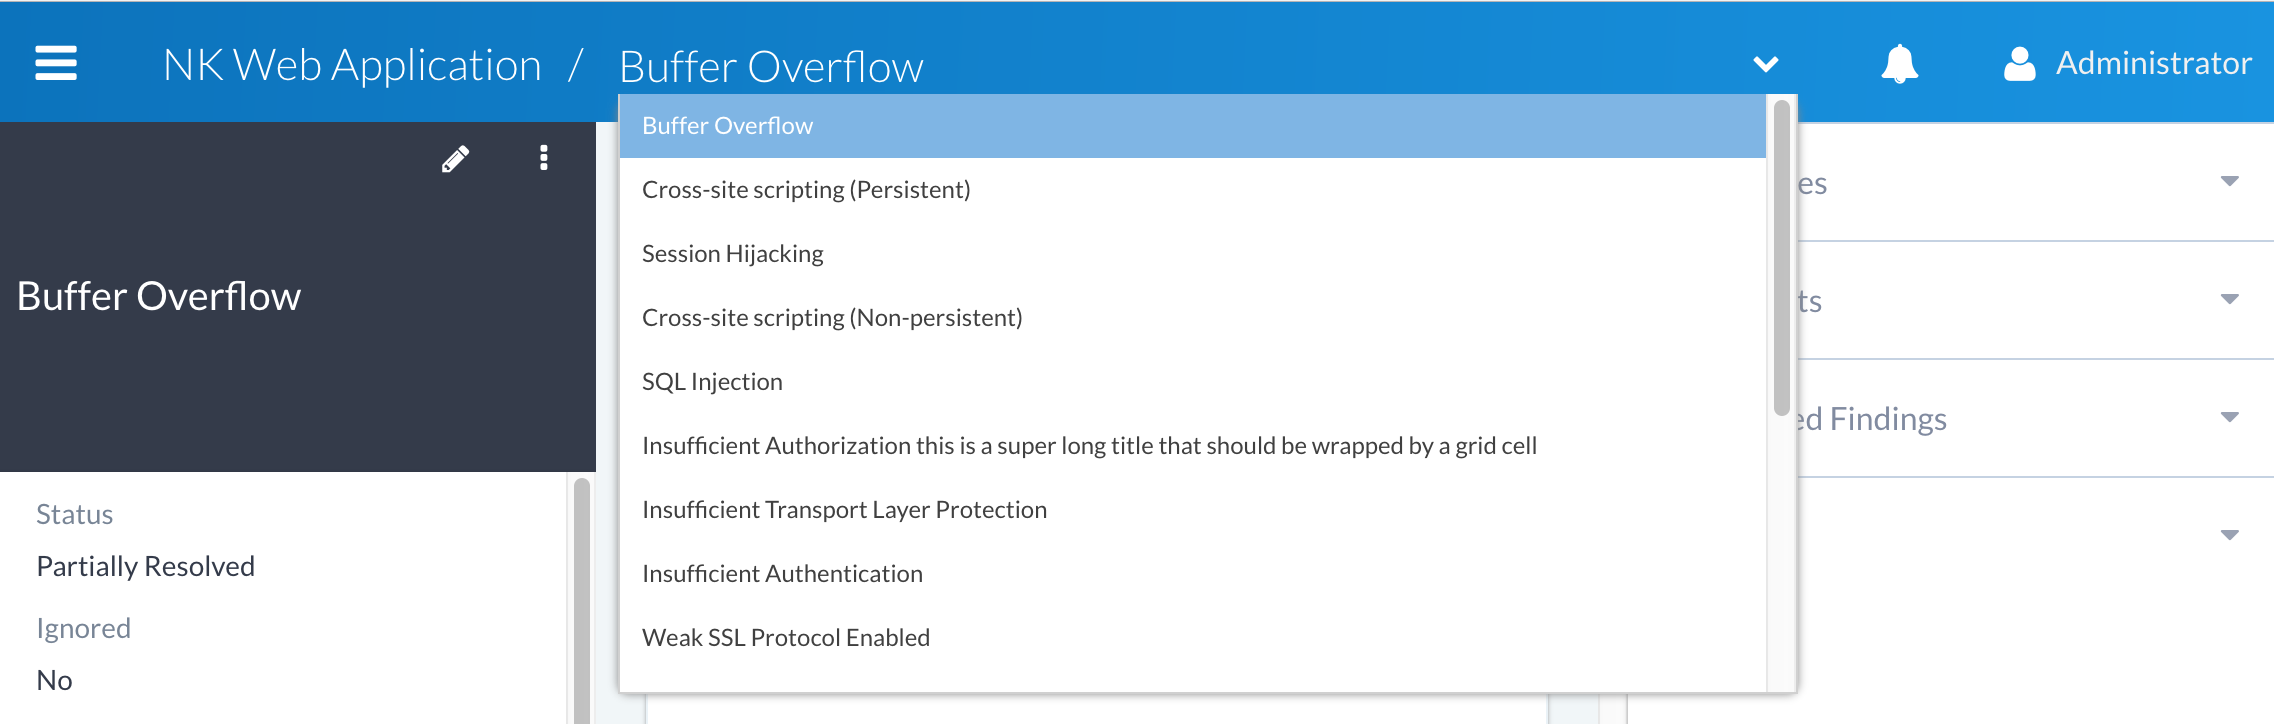
Navigation within a section is typically available via a breadcrumb within the main header. The following screenshot shows an example of navigation within the finding’s view:
Reports start with a template
One of Canopy’s primary uses is to generate a report. In order to generate a report, a report template is required. Without a report template, it’s not possible to generate any reports from Canopy “out of the box”. Creating a report template is usually something we will help you with during the on-boarding process - this is to help you get up and running with Canopy ASAP. However, for users who want to create their own templates, more detailed information is provided in Report templates.
Once a template has been added to the system, it will appear in the Templates → Reports list and as an option when creating reports. For example:
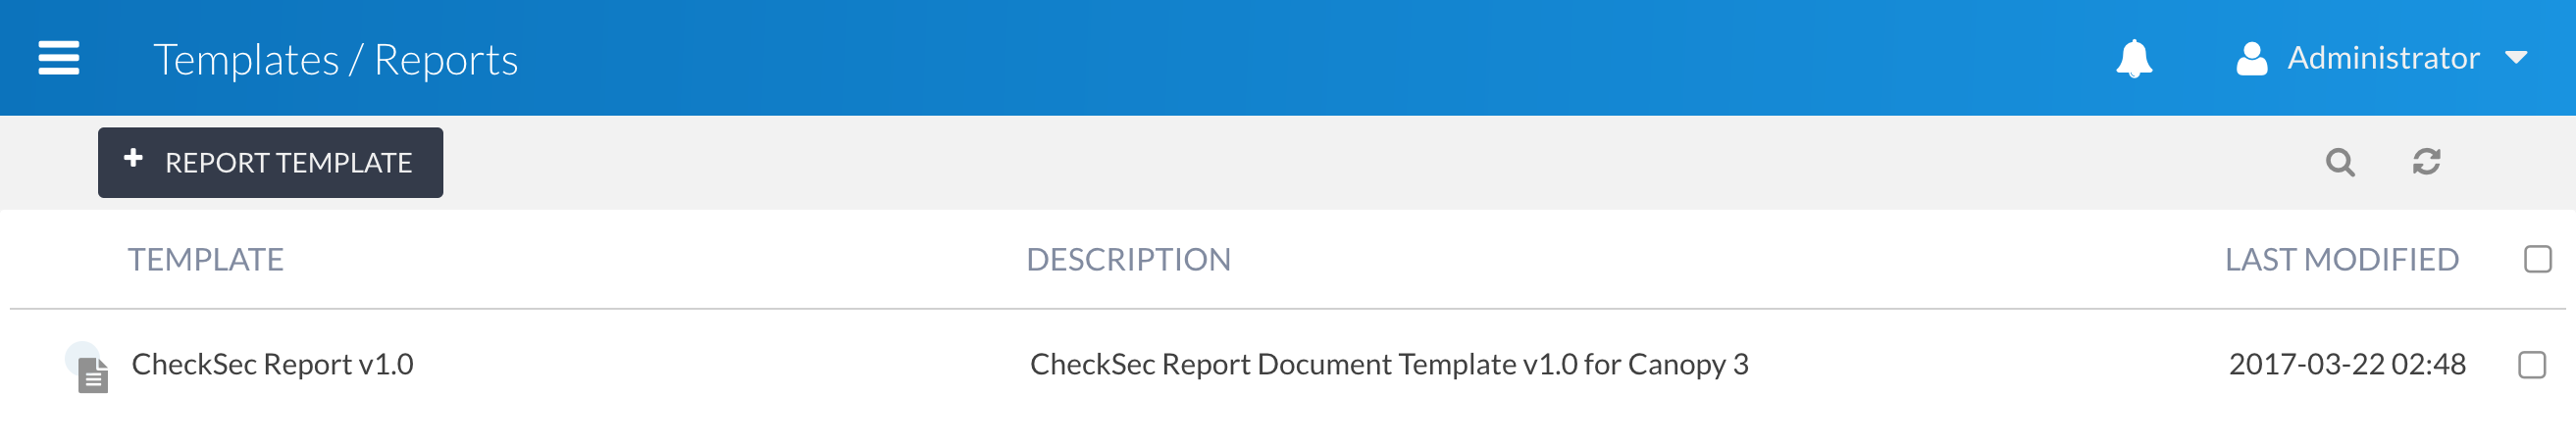
Although it is not absolutely necessary to create a report template to start working with Canopy, it is a requirement to generate a report.
Canopy’s workflow
Everything in Canopy starts with a client. And so does our workflow. The following steps should be followed to go from a starting position - a new client - to the final deliverable - a report.
Create a client
Create a project
Add phase(s)
Add findings (manual, KB, tool sourced)
Add assets and example evidence
Clean up (grouping, removing, ignoring)
Create report
Peer Review / Quality Assure
Generate the report document
All of the steps below assume you are already logged into the system and have a suitable user account to perform them.
Step 1: Create a client
Creating a client is a simple process. Navigate to the Clients
interface and click the Add Client button  .
You will be presented with a wizard to capture the details of the client
and also to set the permissions:
.
You will be presented with a wizard to capture the details of the client
and also to set the permissions:
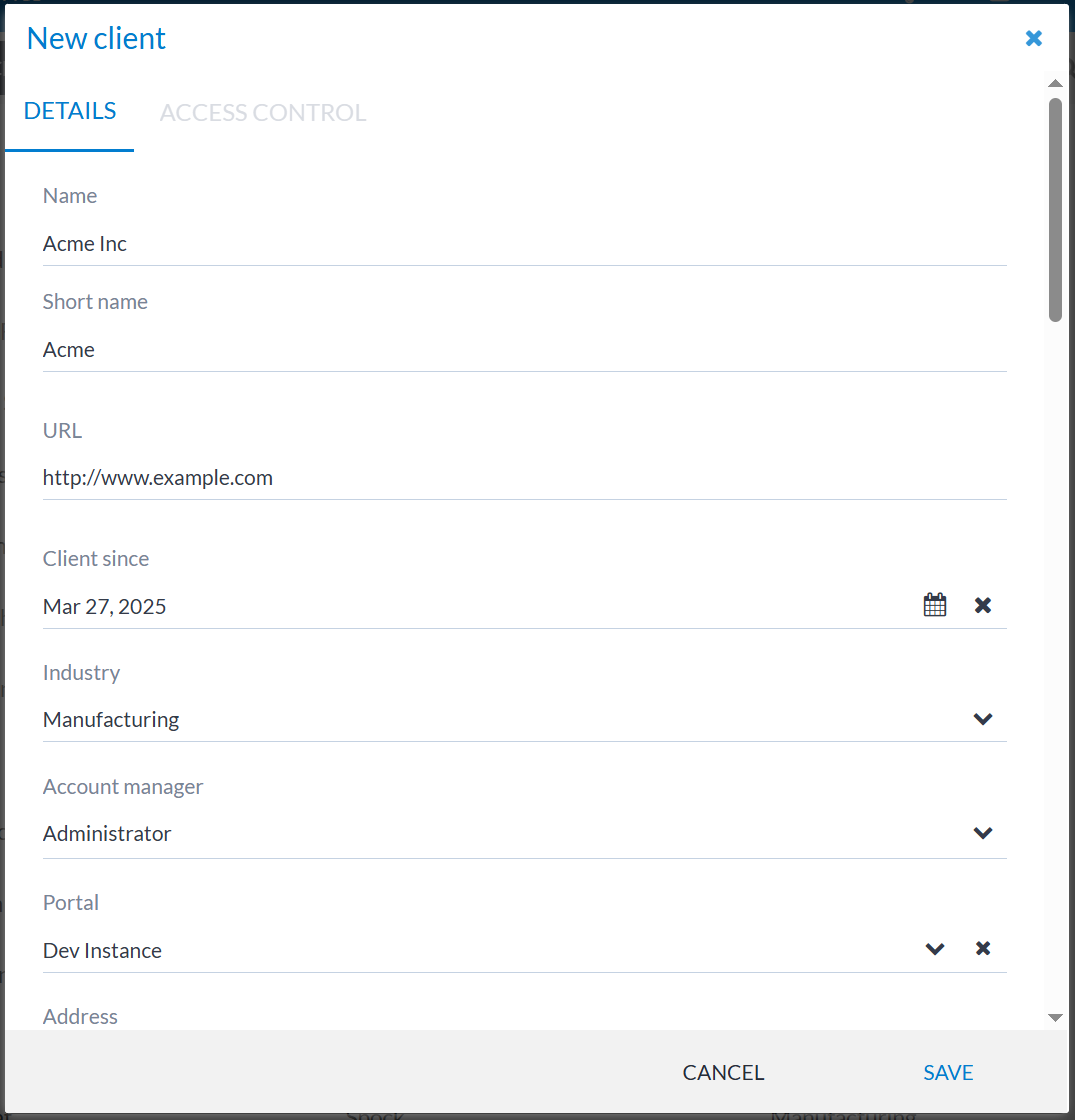
A number of default user profiles have access to the client. For further information see Roles and permissions.
Step 2: Create a project
A project is a container for all of the phases and data (findings, assets, examples, etc.) collected during an engagement.
Adding a project can be done in several ways:
From the client’s projects list
From the main project list
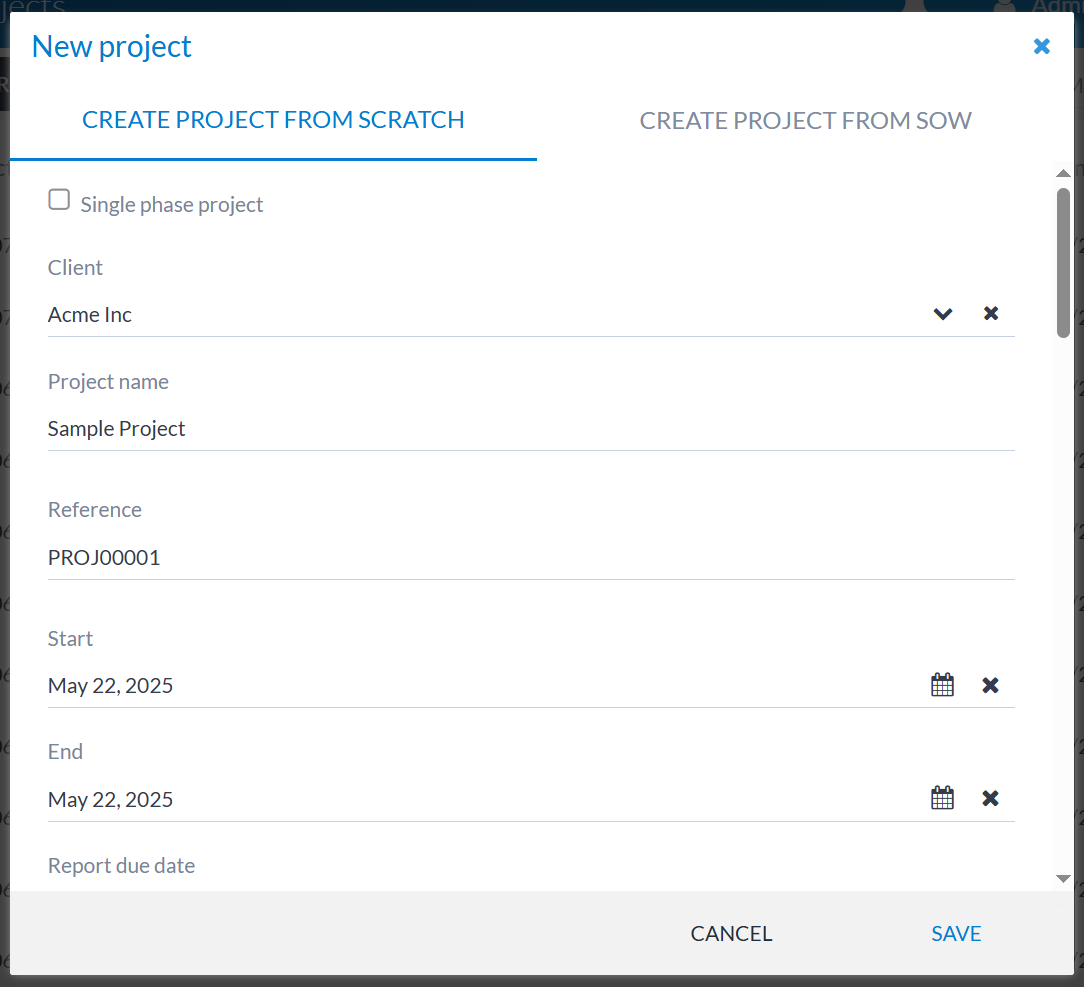
When you initiate project creation, you can choose to create a project from a statement of work or from scratch, as is shown in the wizard:
Once the project is created, the User Access panel is displayed. This can be used to assign who has access to the project.
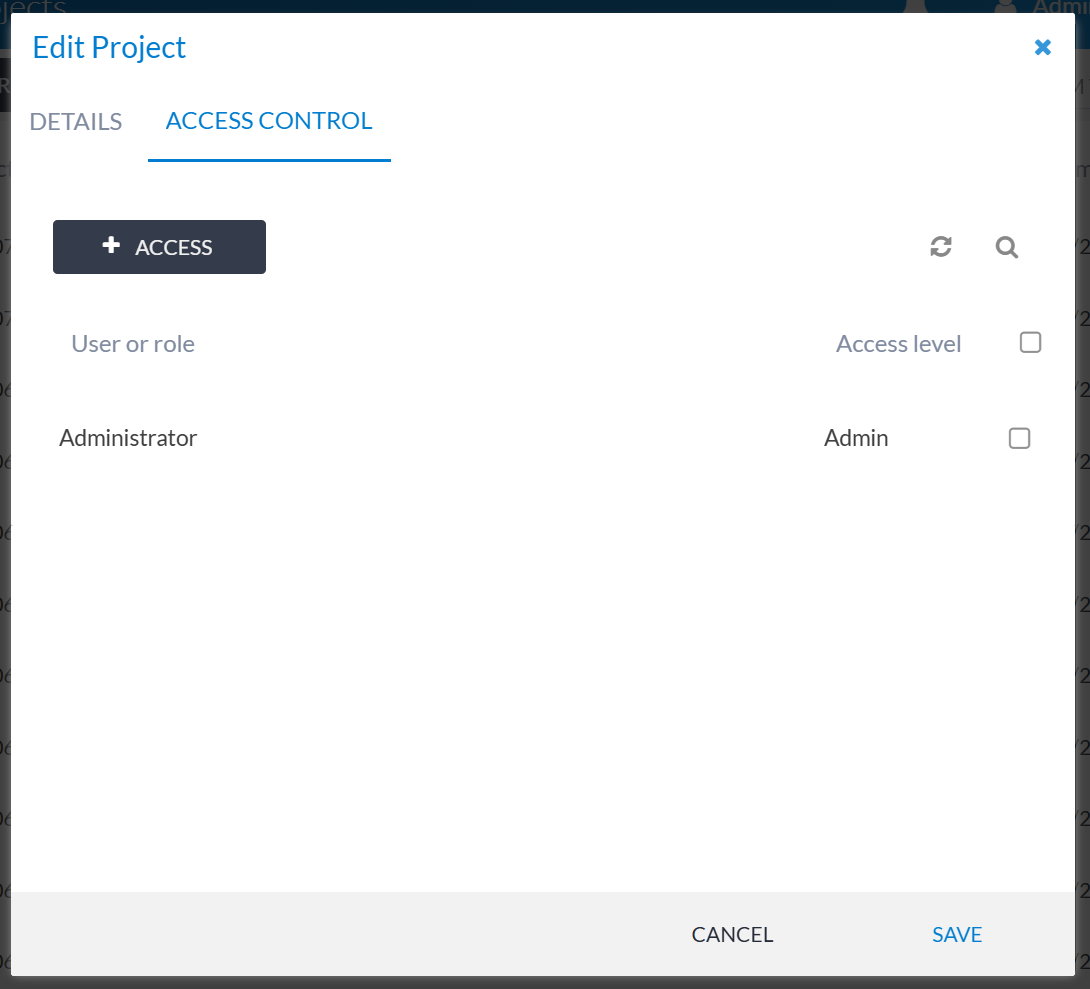
Who has access is different to who is scheduled to work on the project. The upcoming Scheduler feature will assist with assigning resources to a given project and its phases.
Step 3: Add a phase
Adding a phase is similar to adding a project, however, no permissions
need to be granted - these are inherited from the project. Click on
the Add Phase button  . The New Phase form will then be displayed:
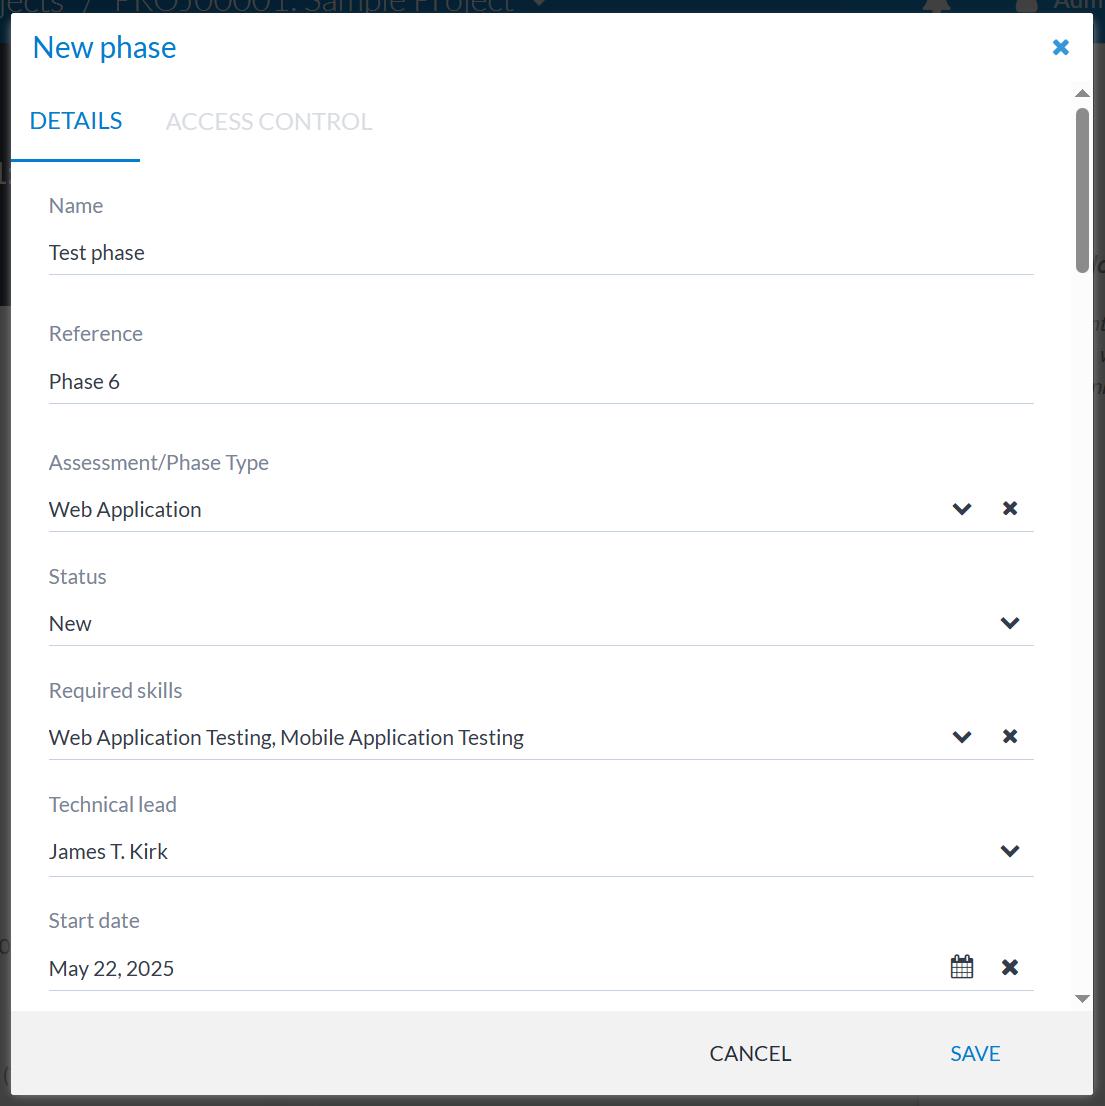
Note
It is possible to create a retest phase.
Step 4: Add findings (manual, KB, tool sourced)
Step 4.1: Add a manual finding
To manually add a finding, click the Add Finding button  .
.
A form will appear where you can details regarding the finding.
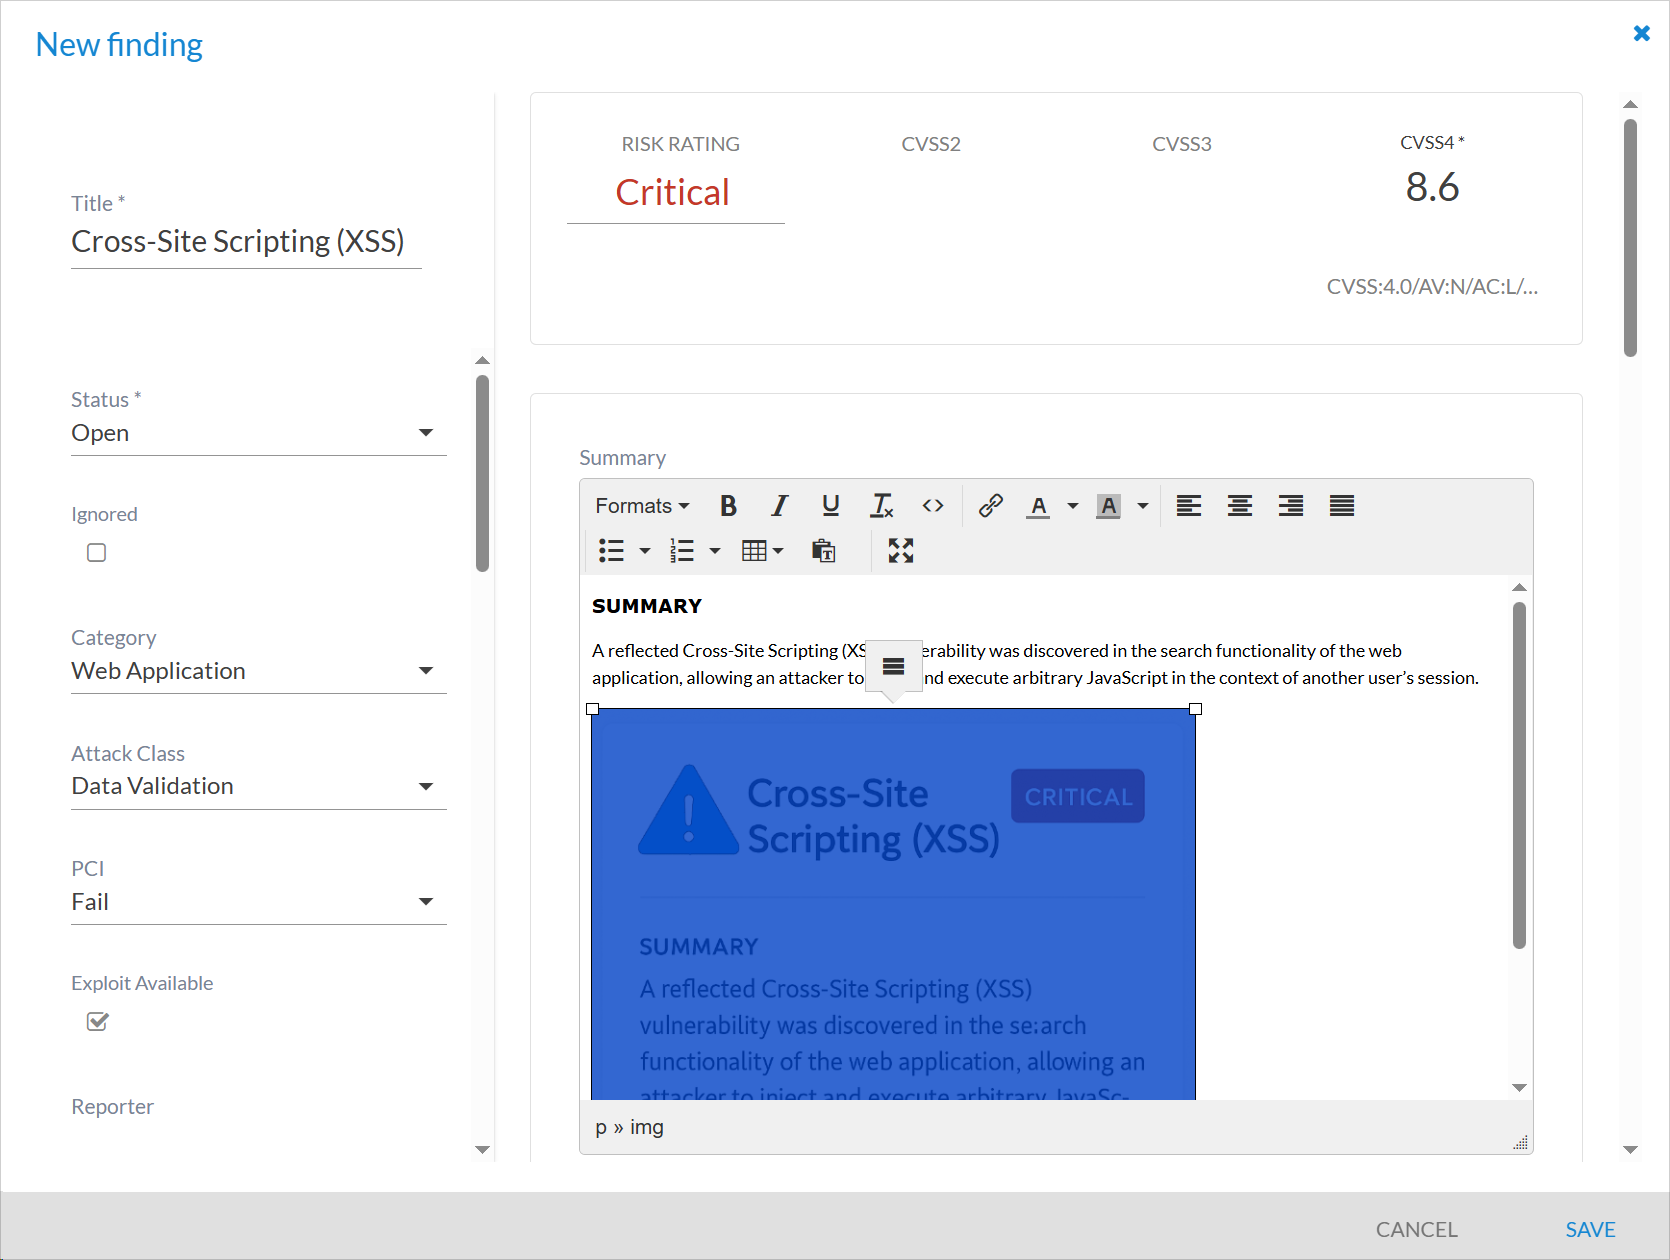
Note
WYSIWYG fields allow you to add rich content, including images. Images can simply be dragged and dropped into the WYSIWYG area.
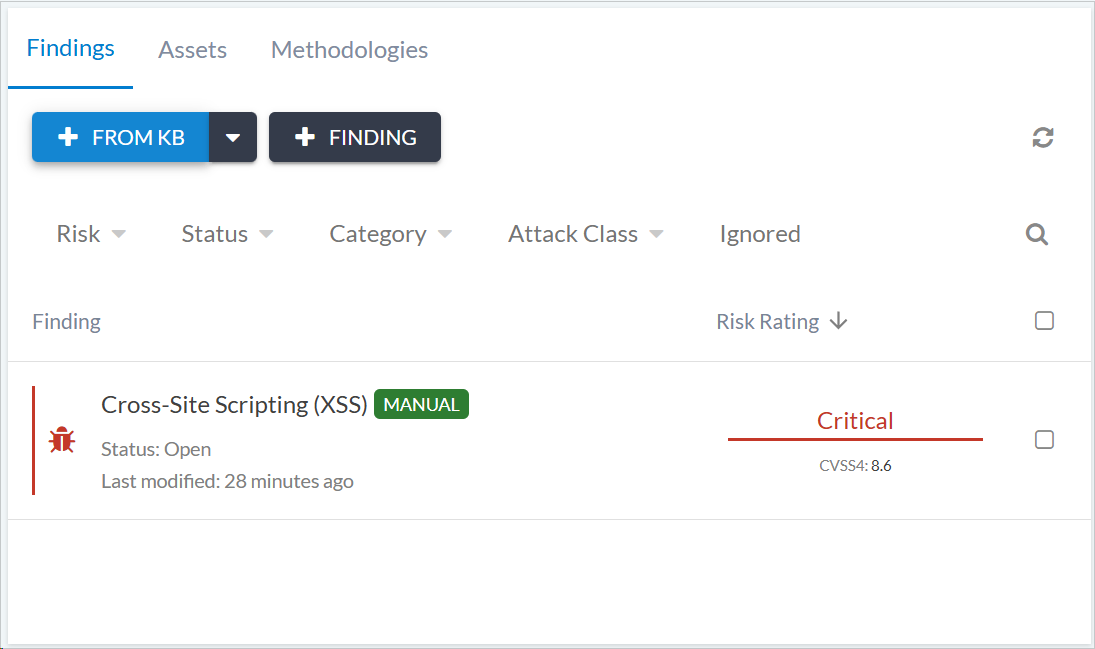
After you save, the finding will be added to the list of findings.
If you click on the finding, you will be taken to the finding view for that finding.
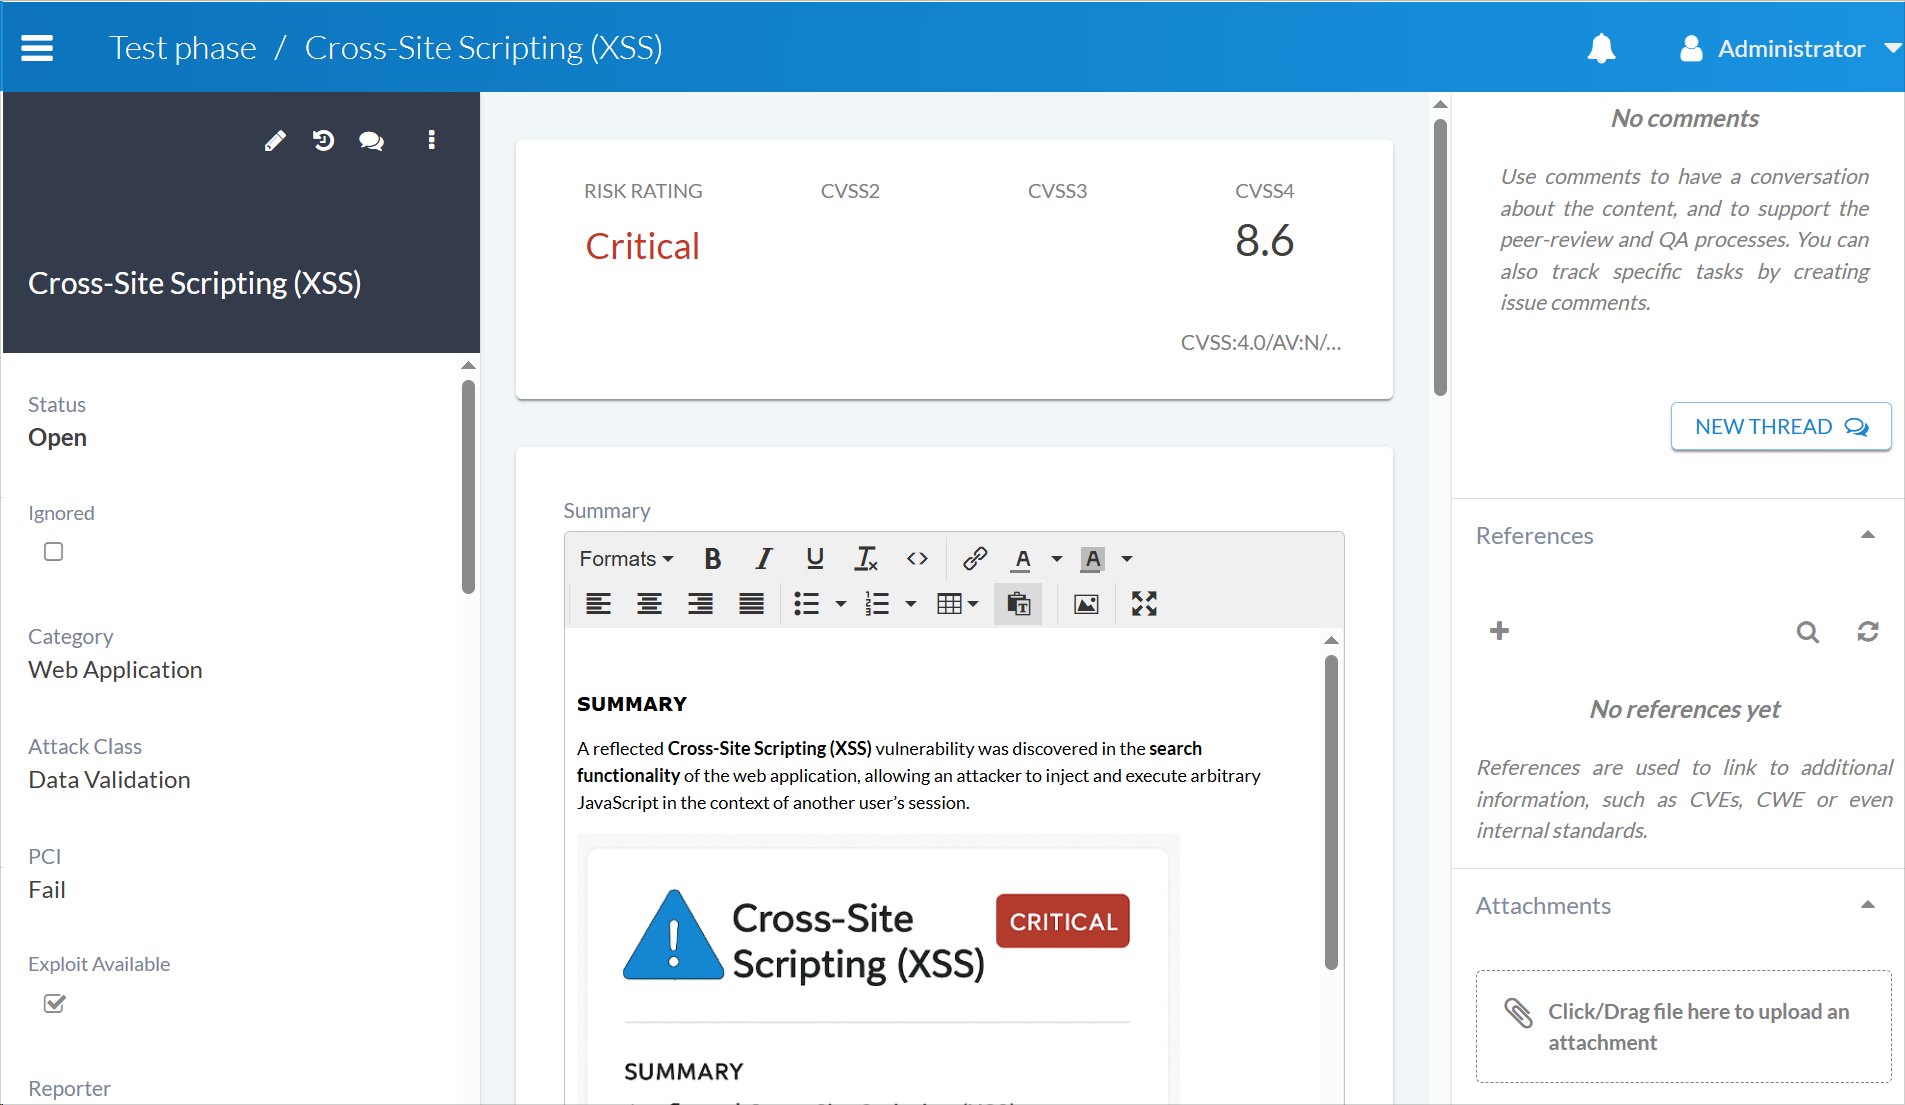
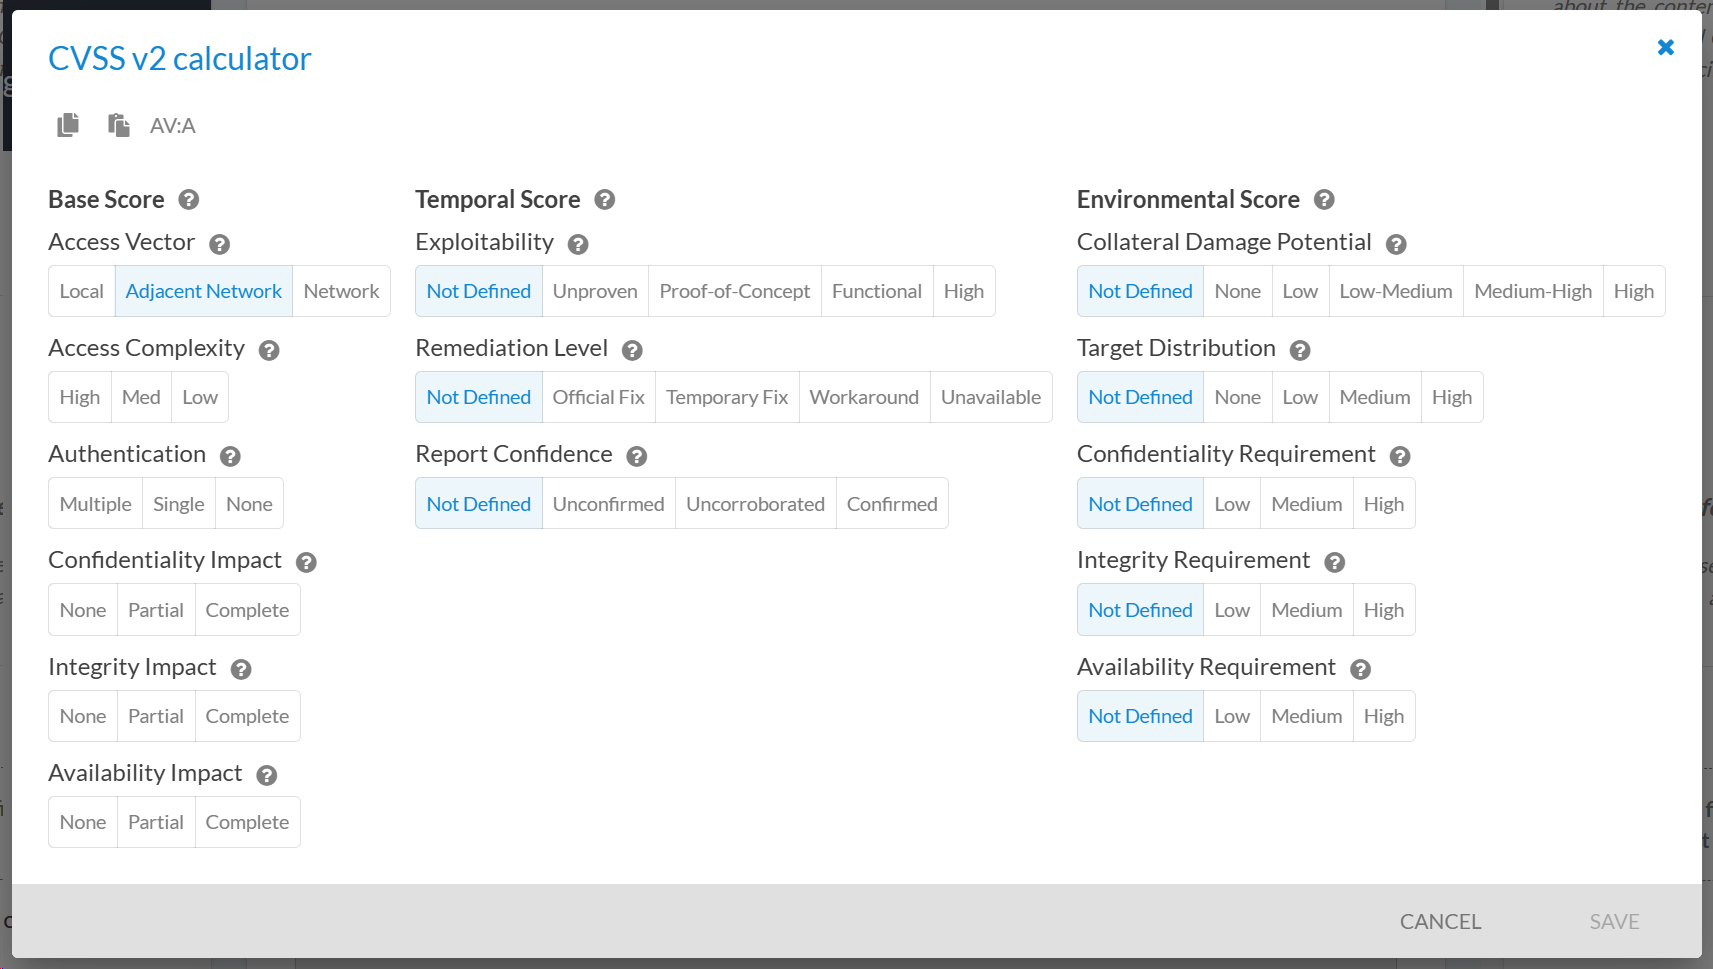
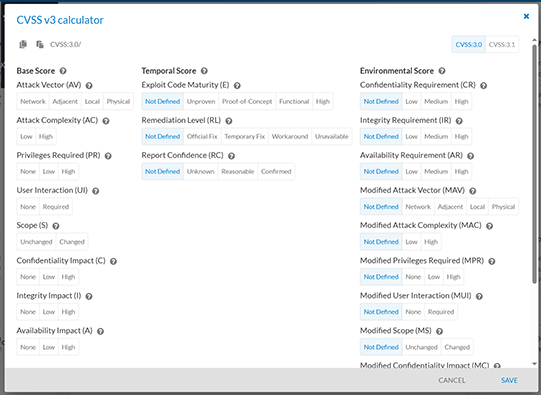
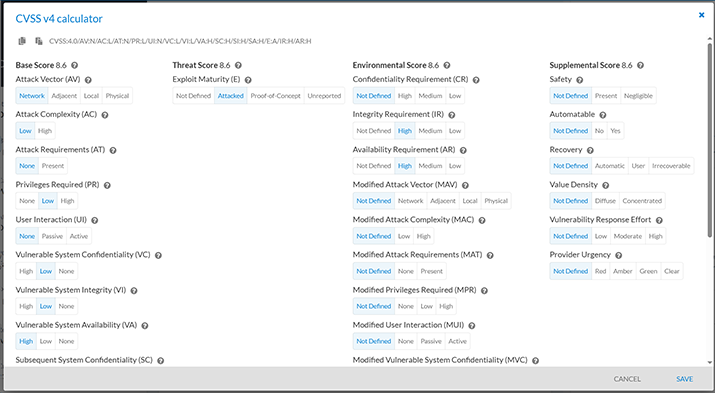
You can set CVSS2, CVSS3 and CVSS4 ratings using the respective calculators:
|
|
|
CVSS v2 Calculator |
CVSS v3 Calculator |
CVSS v4 Calculator |
Step 4.2: Add findings from the KB (Knowledge Base)
Click the Add from KB button  to add a button from the KB.
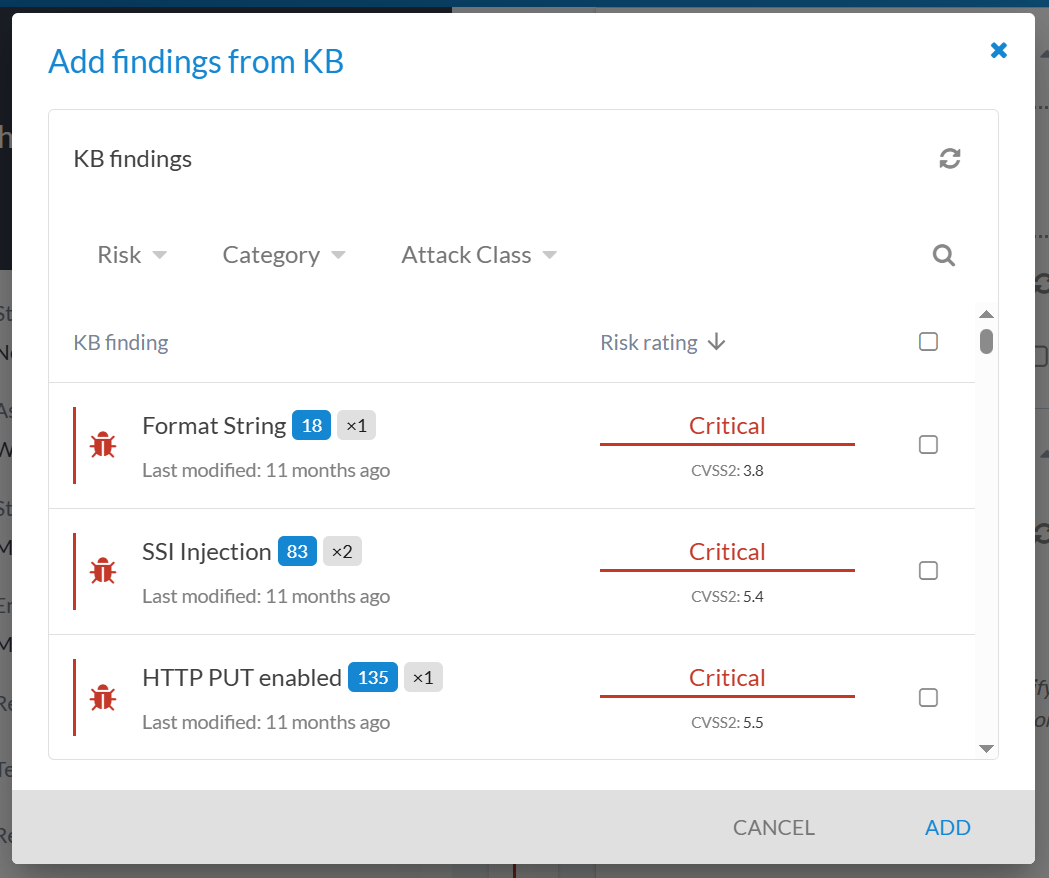
This will give you a list of approved findings to select form, which can be easily added to the phase:
Note
Read about the findings KB (Knowledge Base) here: Findings Knowledge Base.
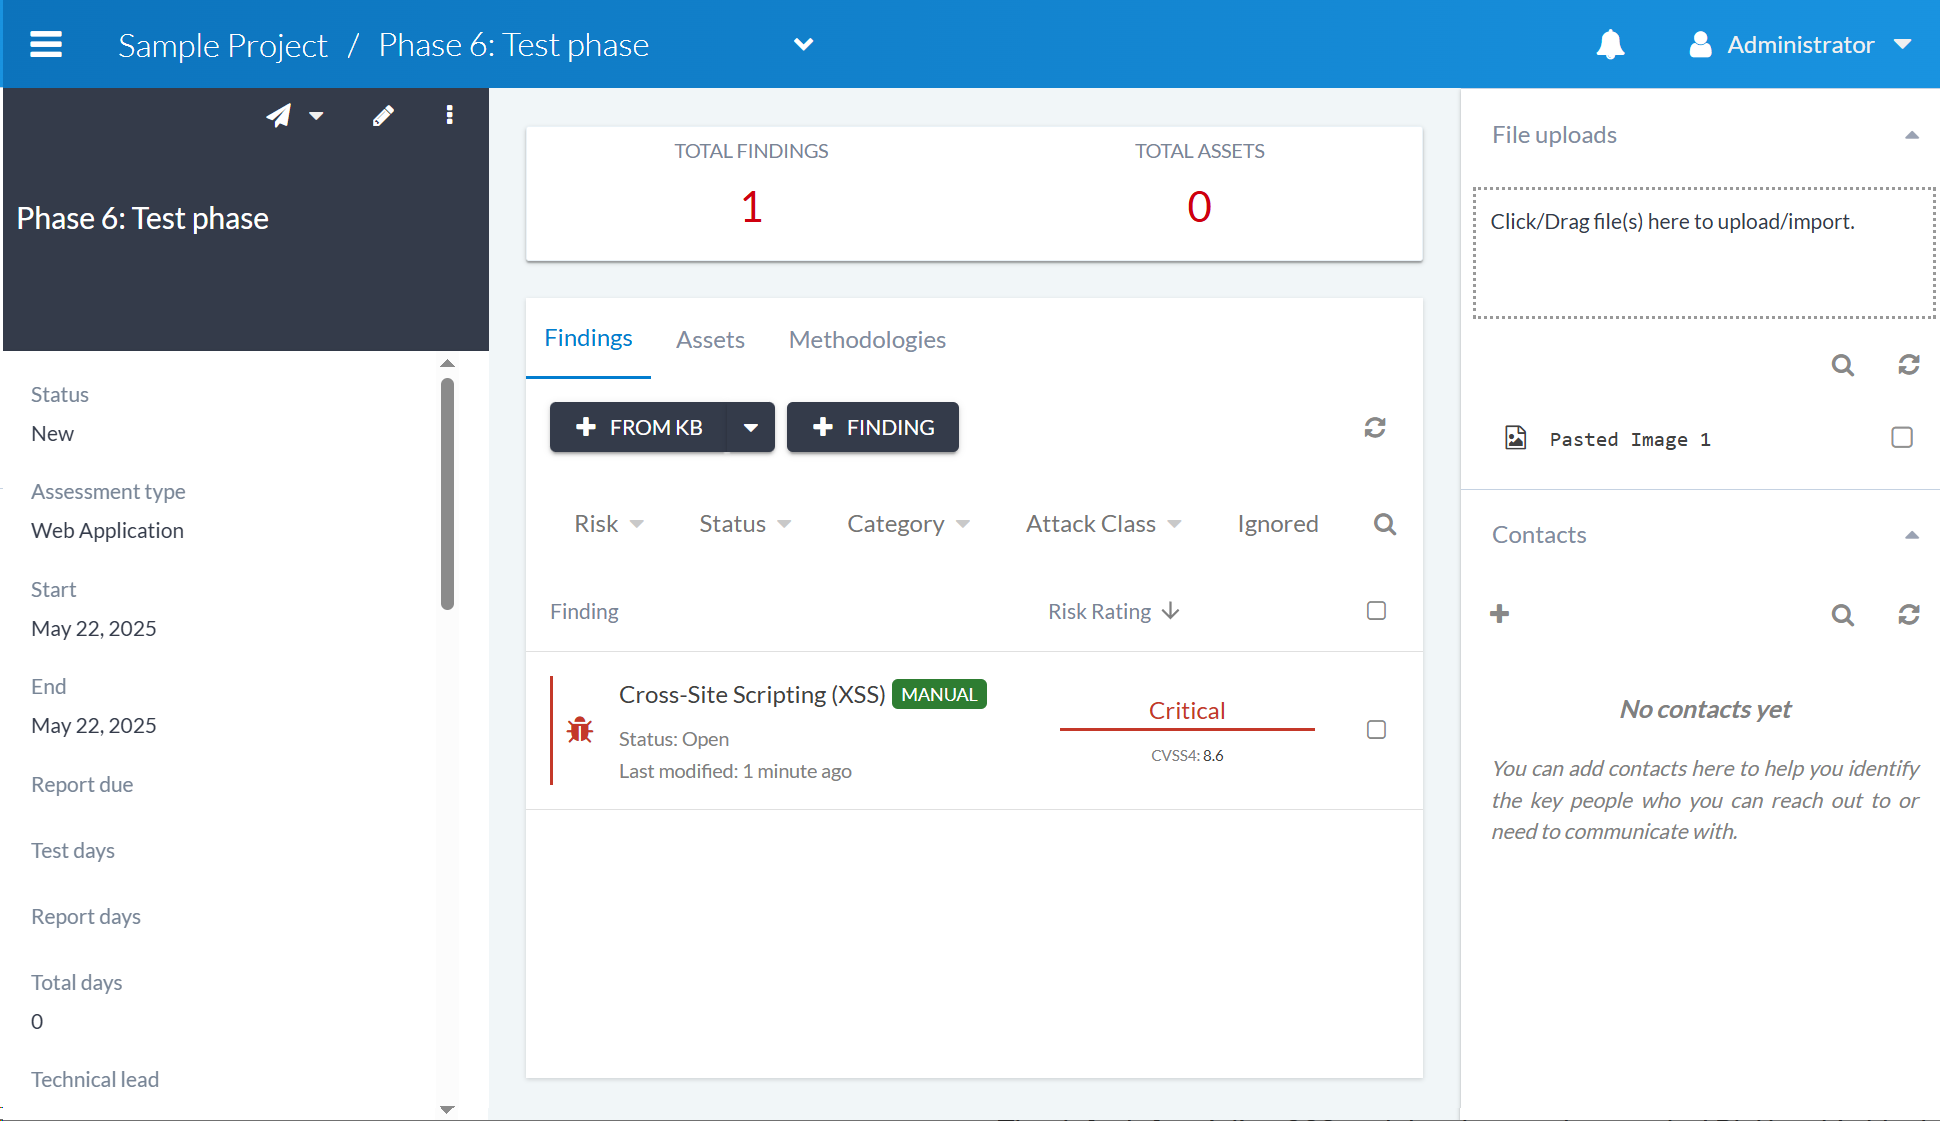
Step 4.3: Import tool data
Importing tool data and other files is as simple as dragging and dropping the file onto the File uploads section on the phase interface:
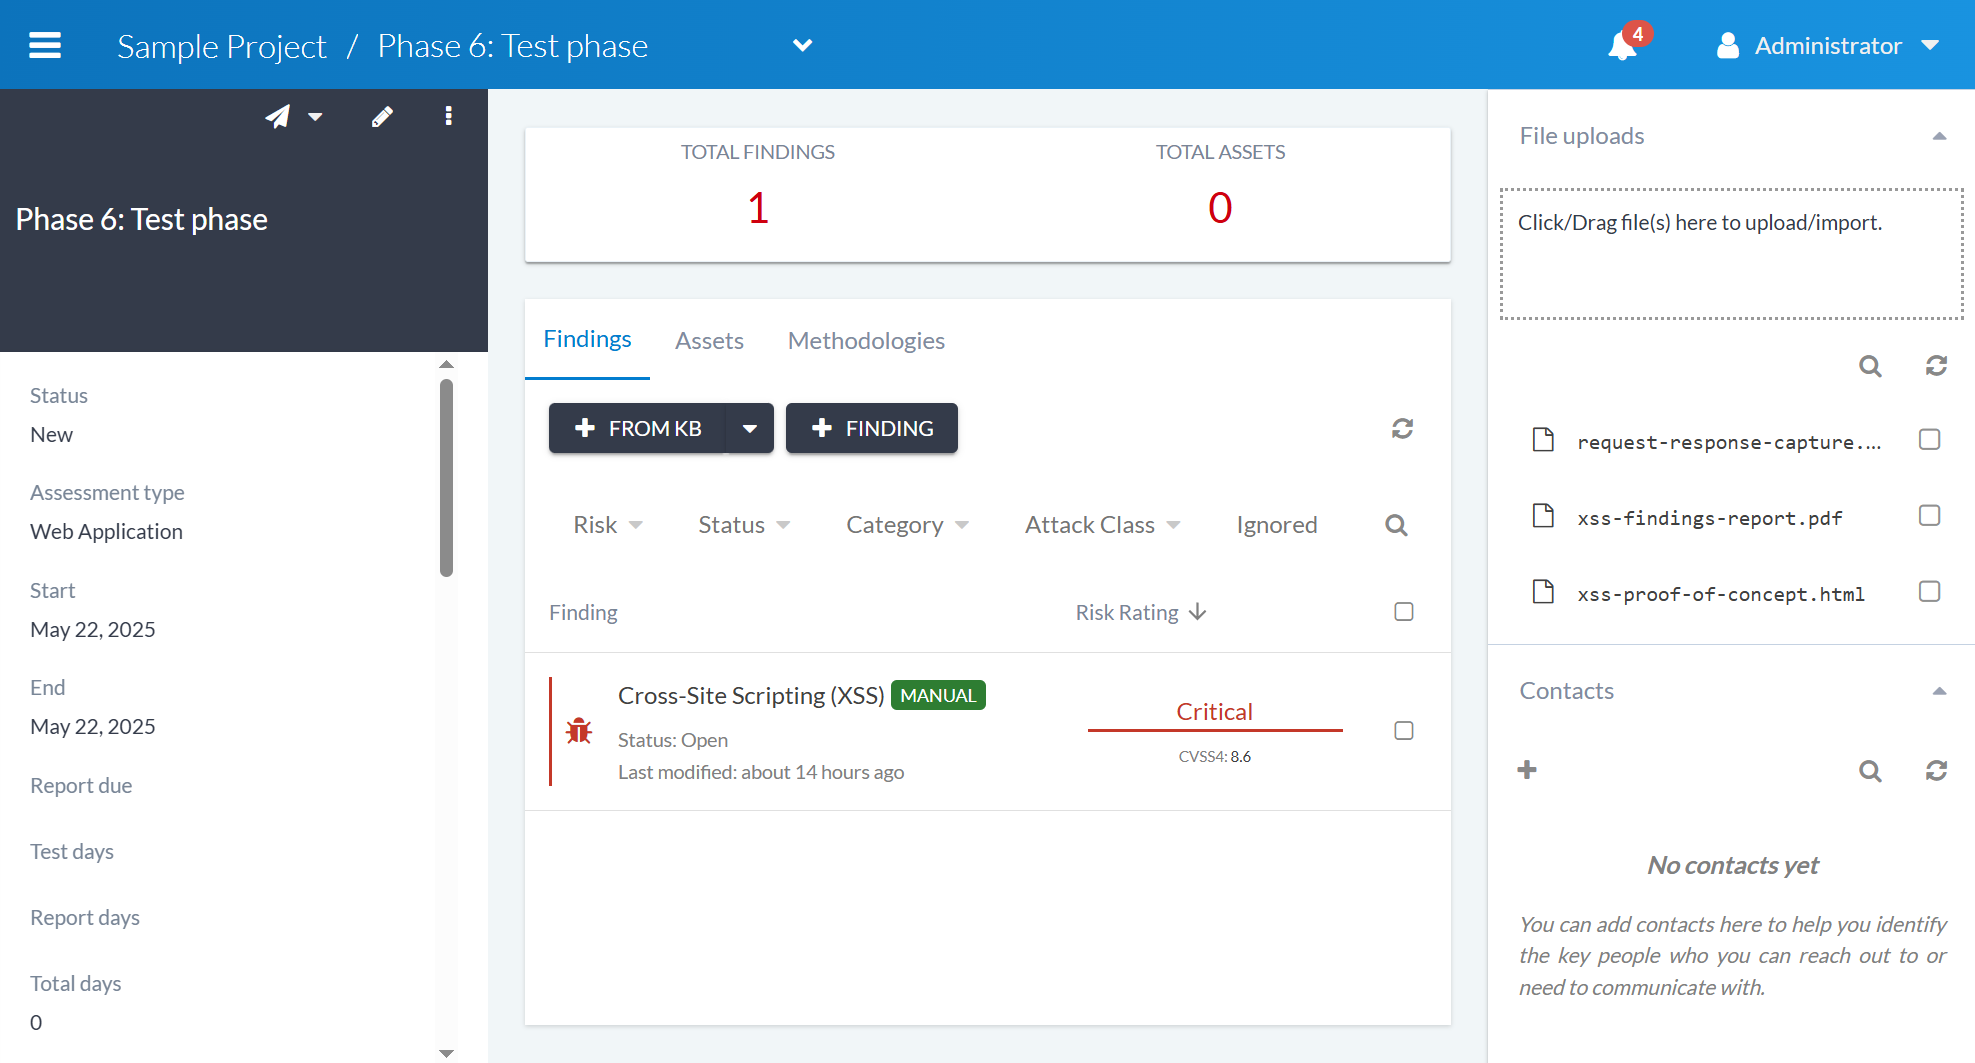
The tool data will be automatically imported and findings will be created. If a tool test case is linked to a KB finding, the KB finding will be added, and the detail from the tool (e.g. detailed examples, meta info) will be retained. By default, automatically generated KB findings linked to tool test cases are grouped, so if you need to report the original tool finding, you can disassociate the tool finding from the KB finding.
For further information on tool importing, see Adding a finding via tool imports.
Step 5: Add assets and example evidence
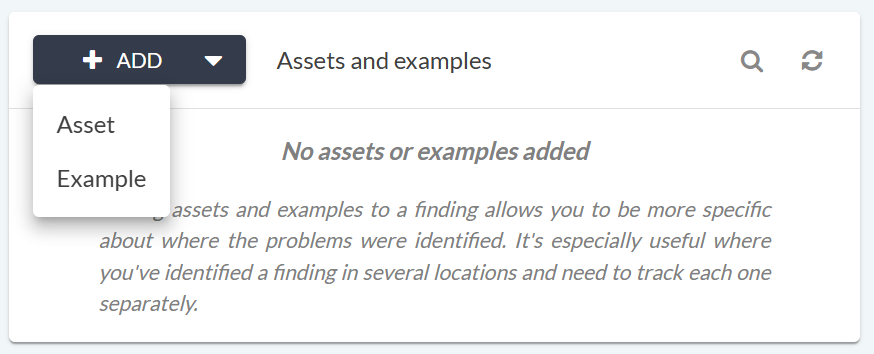
Apart from adding the content to the finding itself, sometimes it’s necessary to add multiple examples of where a finding has been found. Canopy allows you to do this through the use of examples. To add an example, select the option from the Assets and Examples section at the end of the finding screen:
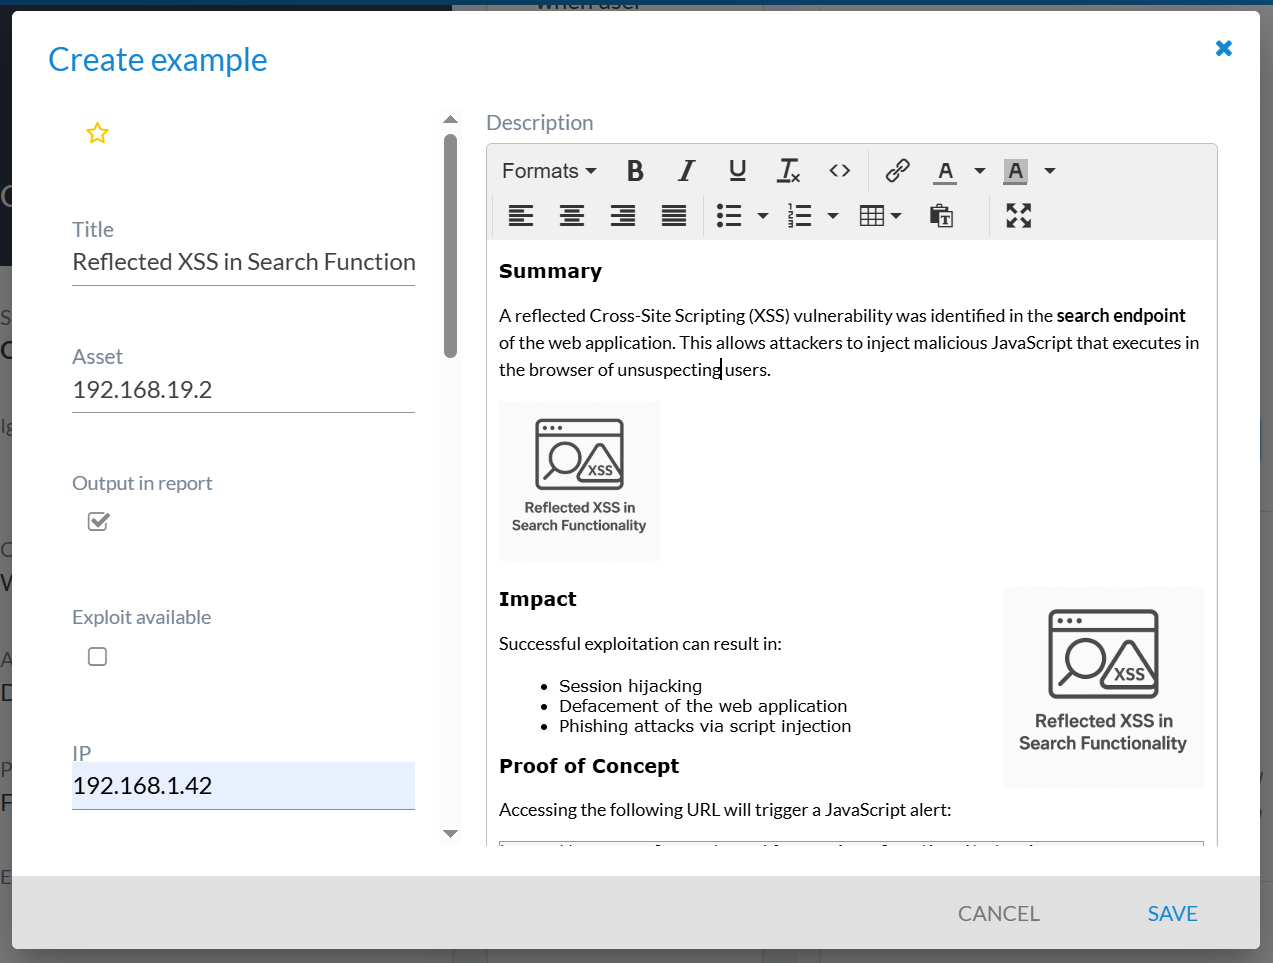
An example can contain rich text and images, you can also add an asset to the asset field and it will be automatically associated with the finding:
Examples can store one or many instances of a finding. Examples are auto-populated from tools that separate them out from the main finding. See below for an example.
Step 6: Organise and clean up
If you’ve added data from tools, you probably have a lot of similar findings, excessive informational findings and potentially false positives. Rather than sending a 500 page report to your client, it’s probably desirable to clean up the findings before you create your report. There are three main approaches:
Group similar findings together
Mark findings as ignored / false positive
Delete findings
Deleting findings is not typically recommended. It should only be used if you’ve imported/added the wrong findings. The reason is for ensuring you maintain a complete data set, which can eventually be analysed beyond the individual project/phase. However, Canopy does not restrict you from deleting findings - this is more of a good practice observation. The remaining strategies for cleaning up findings are explained below.
In an upcoming release of Canopy it will be possible to selectively include/exclude findings from reports, with filtering based on parameters such as assets.
Step 6.1 Group similar findings
Grouping of findings is one of the most powerful features available for testers. It allows you to take a selection of similar findings, and group them into a single finding. Some example scenarios of where this is useful include:
Grouping together multiple Microsoft missing patches
Grouping together multiple SSL/TLS misconfiguration issues
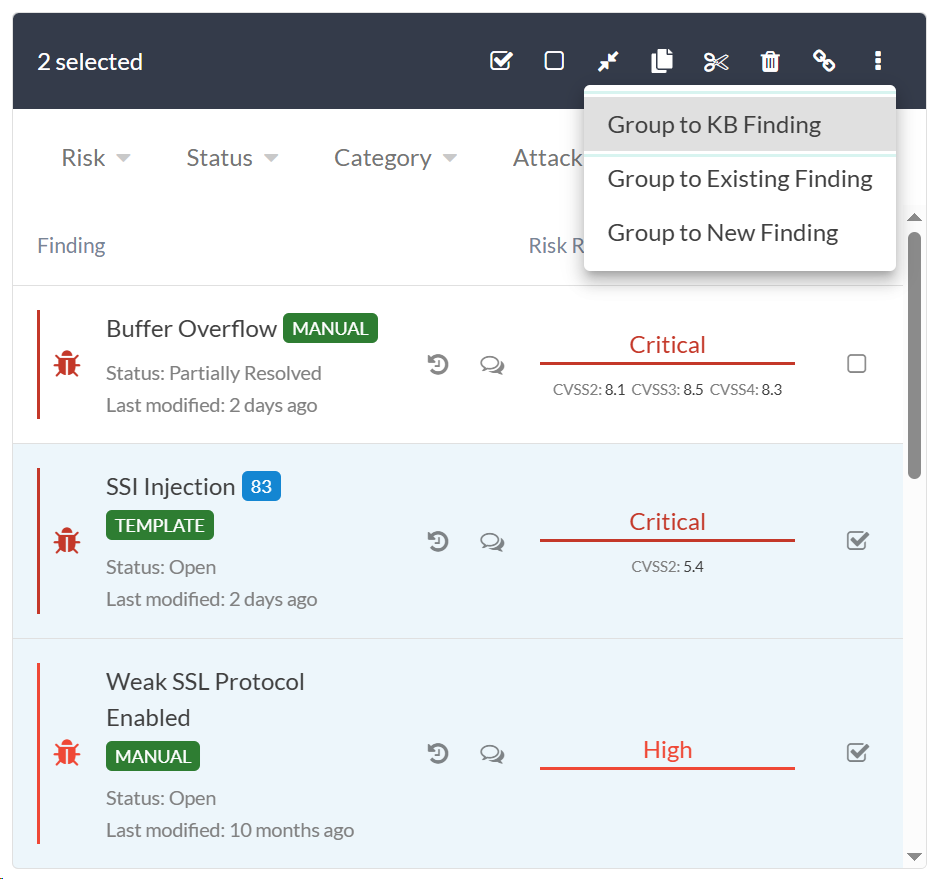
To group findings, first select the findings you want to group together. Then click the Group Findings button from the action bar.
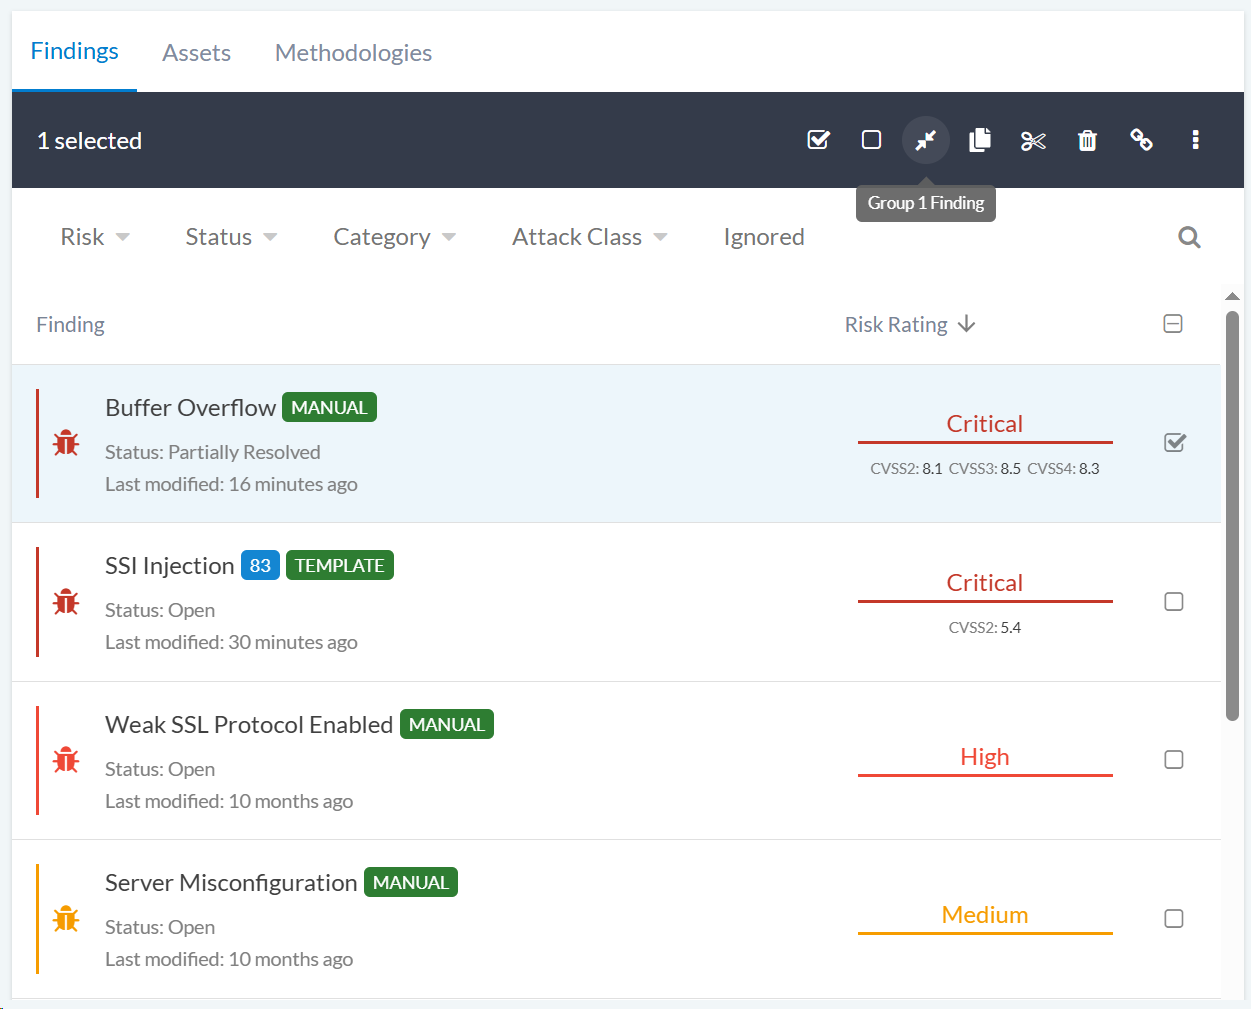
After clicking the button, a dropdown menu will appear with three options:
Group to KB Finding: This will create a new finding from the KB and add the selected findings as children.
Group to Existing Finding: This will add the selected findings as children of an existing finding. This is useful when a “master” finding already exists in the project.
Group to New Finding: This allows you to create a completely new finding, with the selected findings as children.
Only one group can be created at a time.
For more detailed information on grouping findings, see Findings.
Step 6.2: Ignore findings
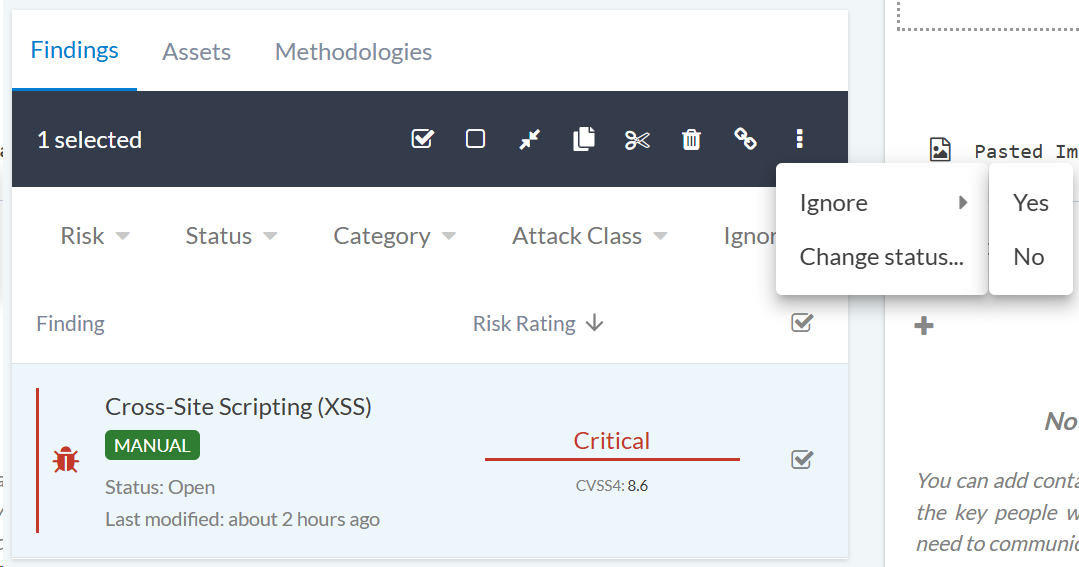
There may be many findings you simply want to ignore. This is quite typical with informational findings that might come from tools. You can ignore a finding by selecting the findings you want to ignore, then clicking on the “More” button, selecting “Ignore” and then choosing “Yes” or “No”:
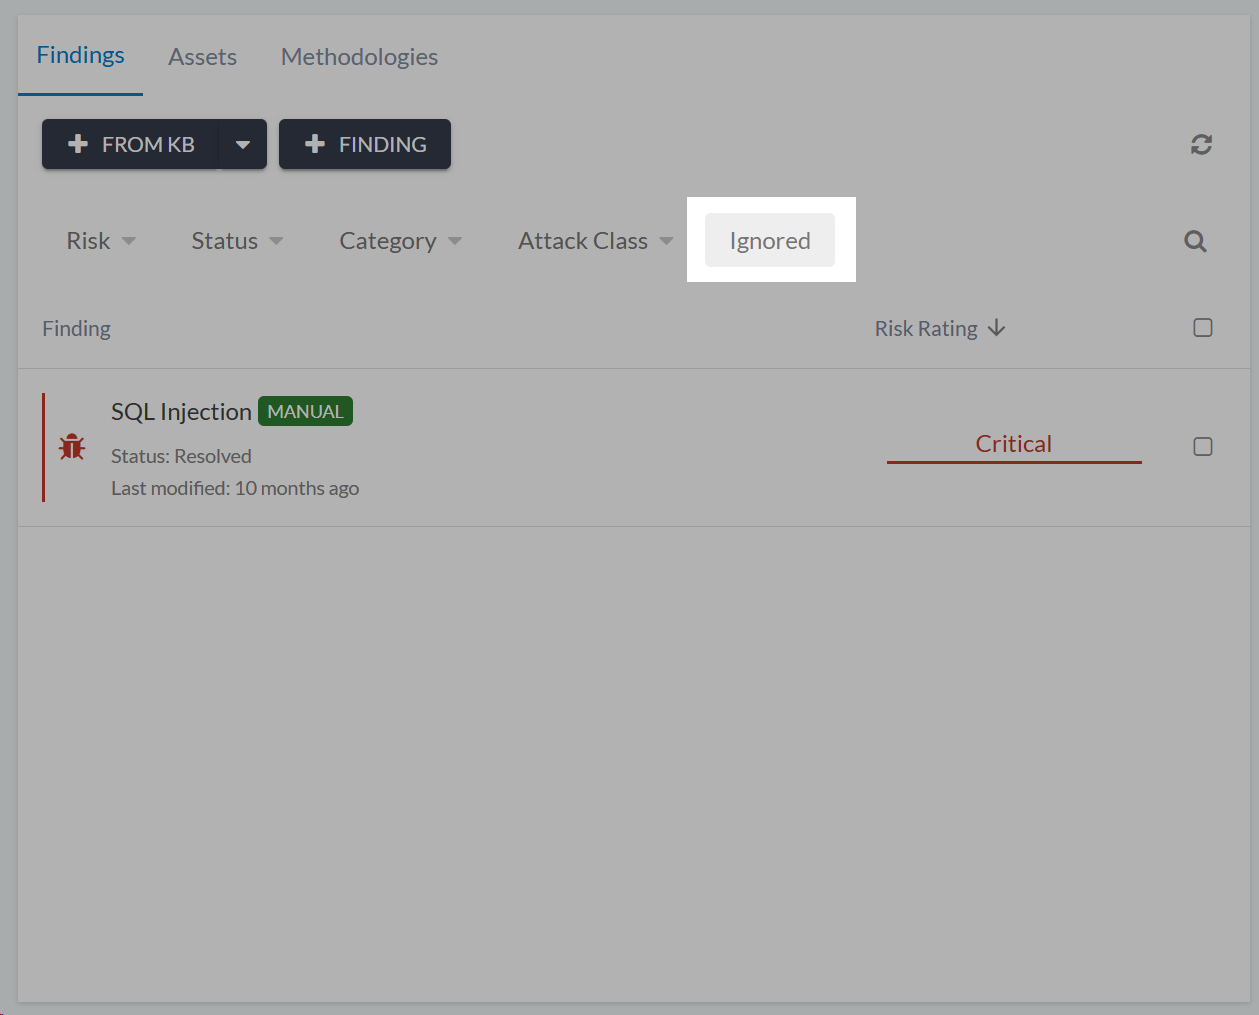
To see ignored findings, click on the “Ignore” button in the filters:
Optional: Add findings to the KB
Once you gone through the process of making sure your findings are of a high quality, you can then add them to the KB. This can be achieved in the finding view, by clicking on the ellipsis menu and selecting the Add to KB option. The new KB finding will be added in an unapproved state, which means someone with the correct permissions needs to review and approve it before it can be used by other members of the team. For more details on the KB see Findings Knowledge Base.
Step 7: Create a report
Any user with admin permissions on a project can create a report. This
is done from the project level via the + REPORT button  .
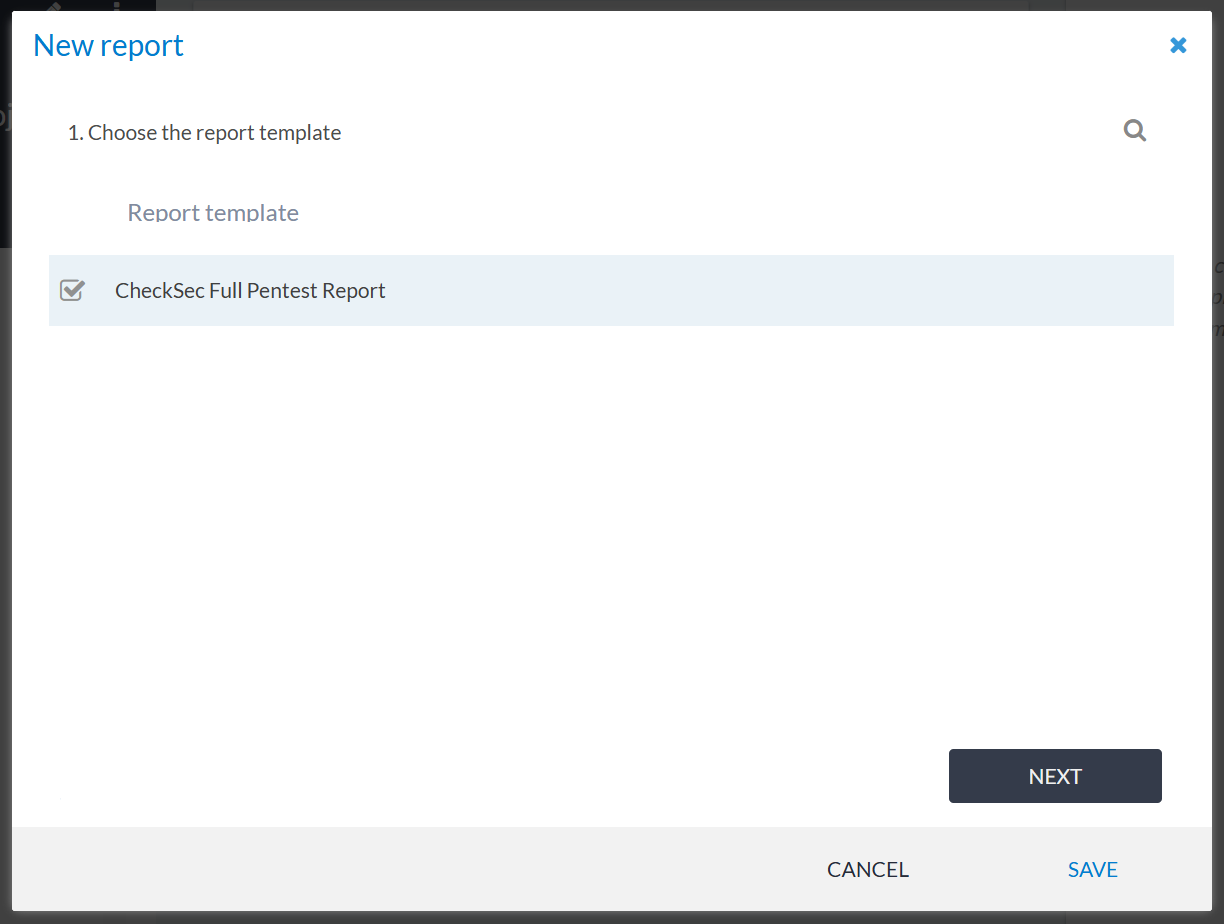
This launches the New Report wizard, which is a three-step process.
.
This launches the New Report wizard, which is a three-step process.
Step 1: Select the report template
The first step in the wizard is to select the report template.
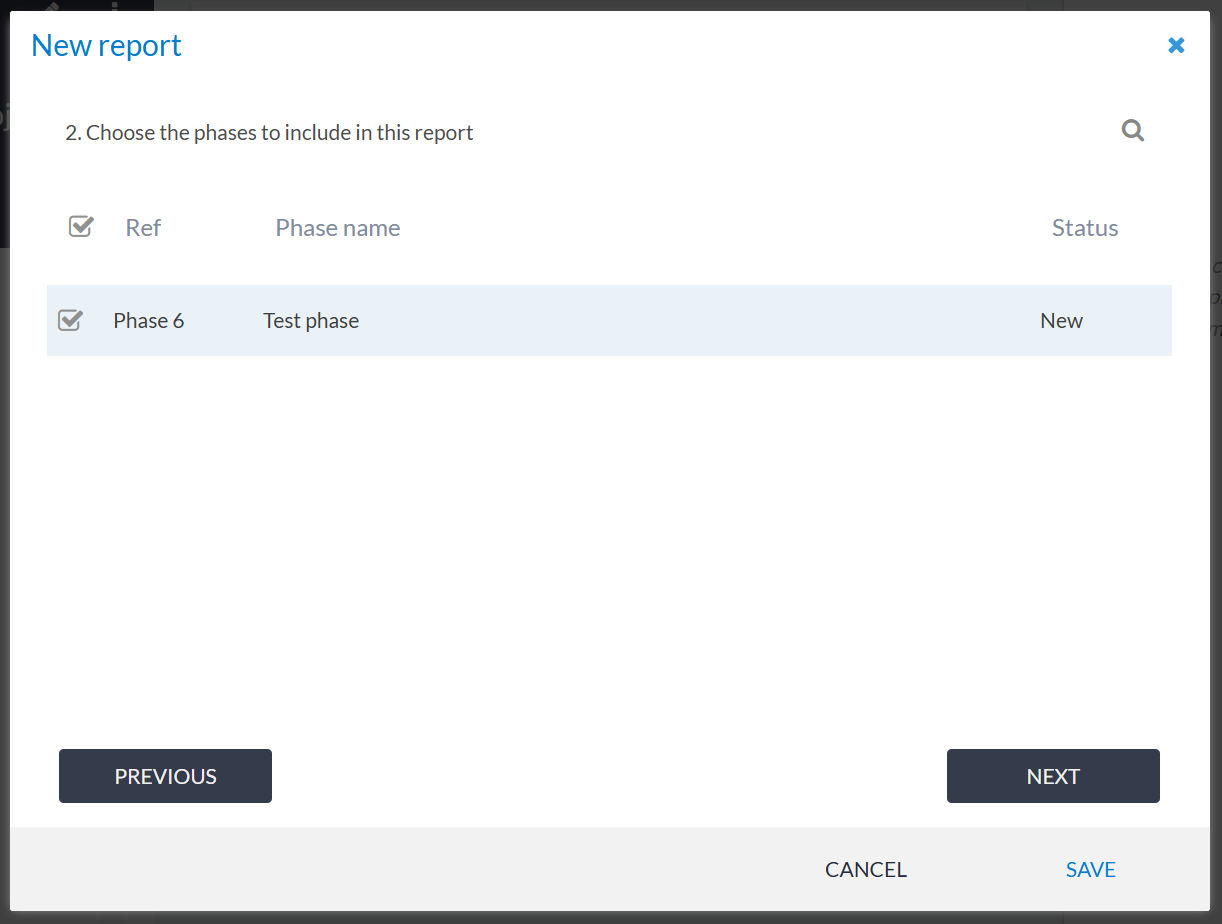
Step 2: Select the phase(s)
The next step is to select the phase(s) to associate with the report.
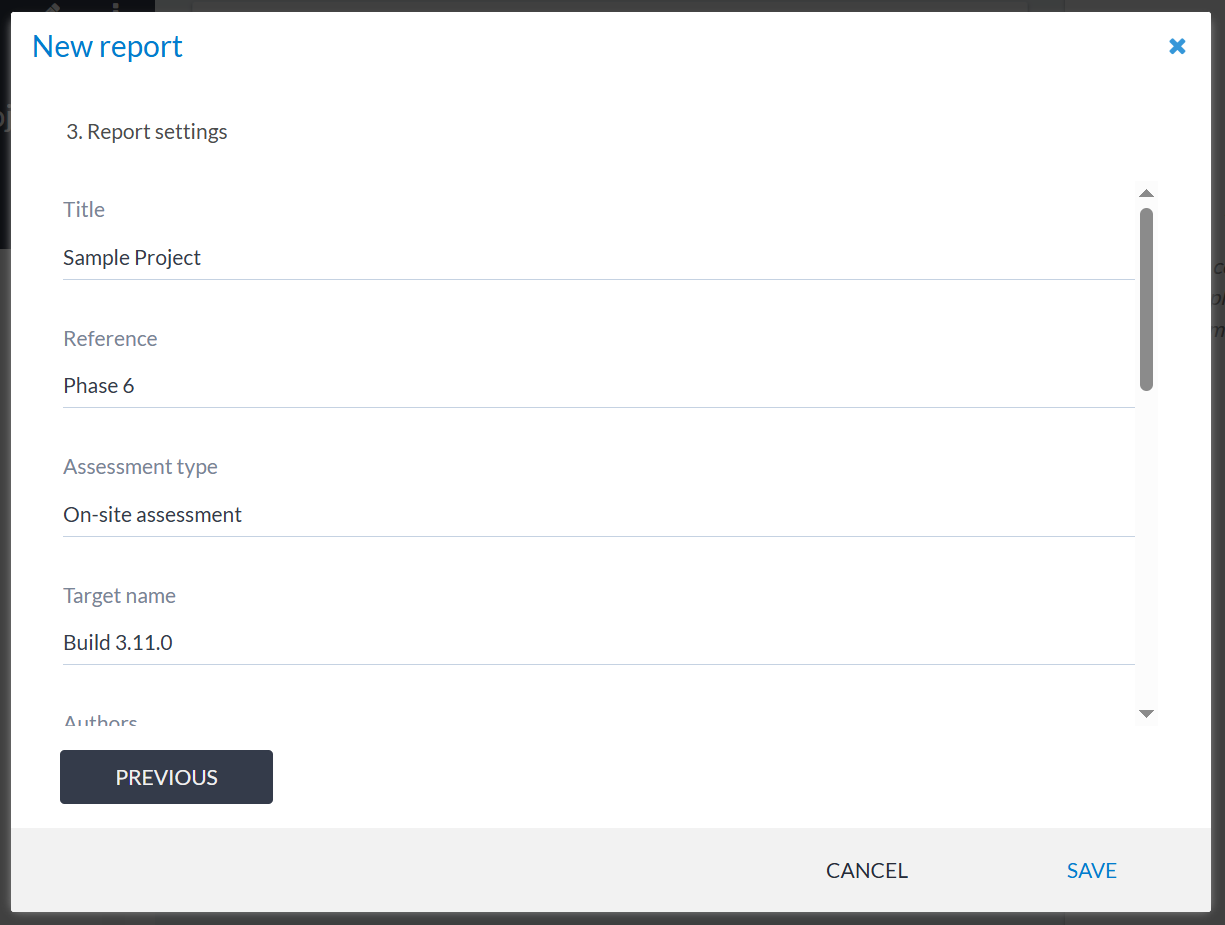
Step 3: Set the report details
The final step is to set the report details.
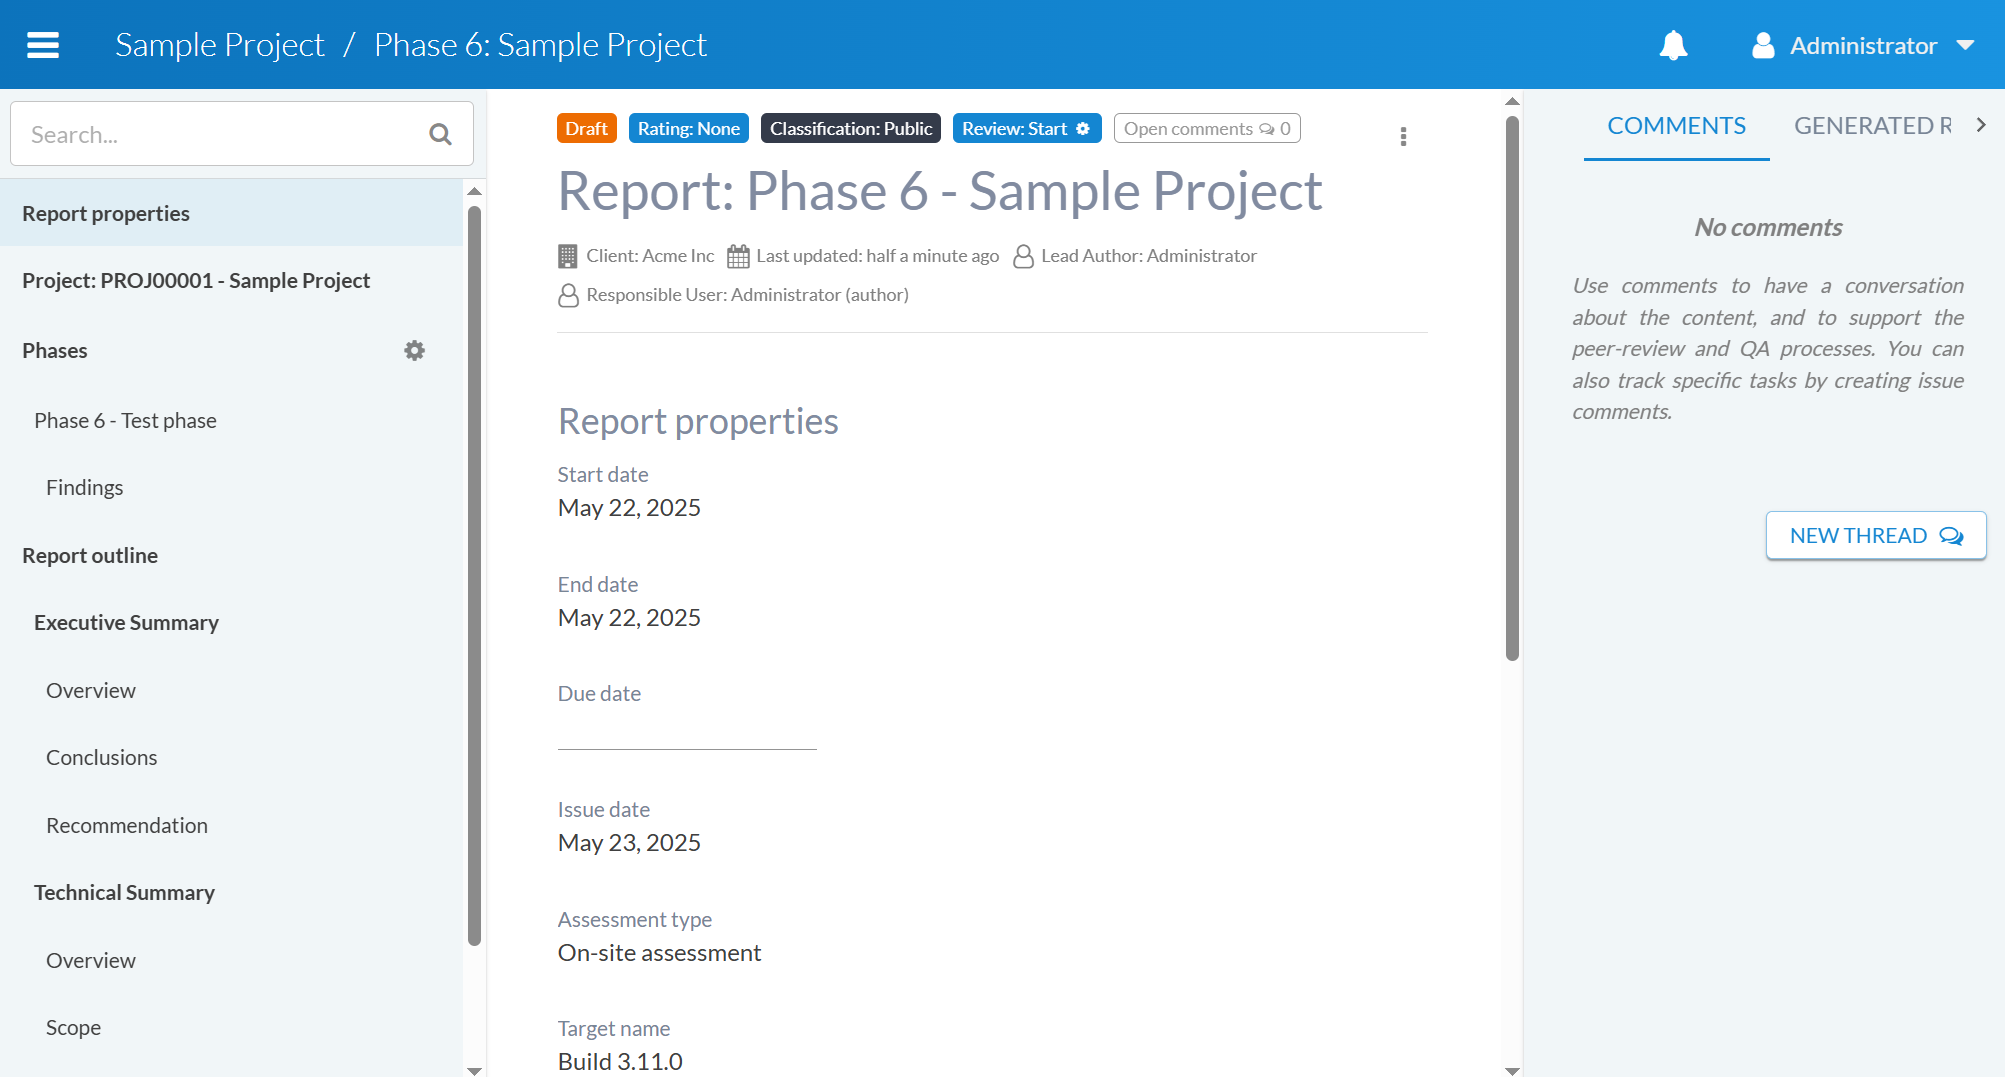
Once the report has been created, you will be able to start working on the report’s content and also adding any necessary comments.
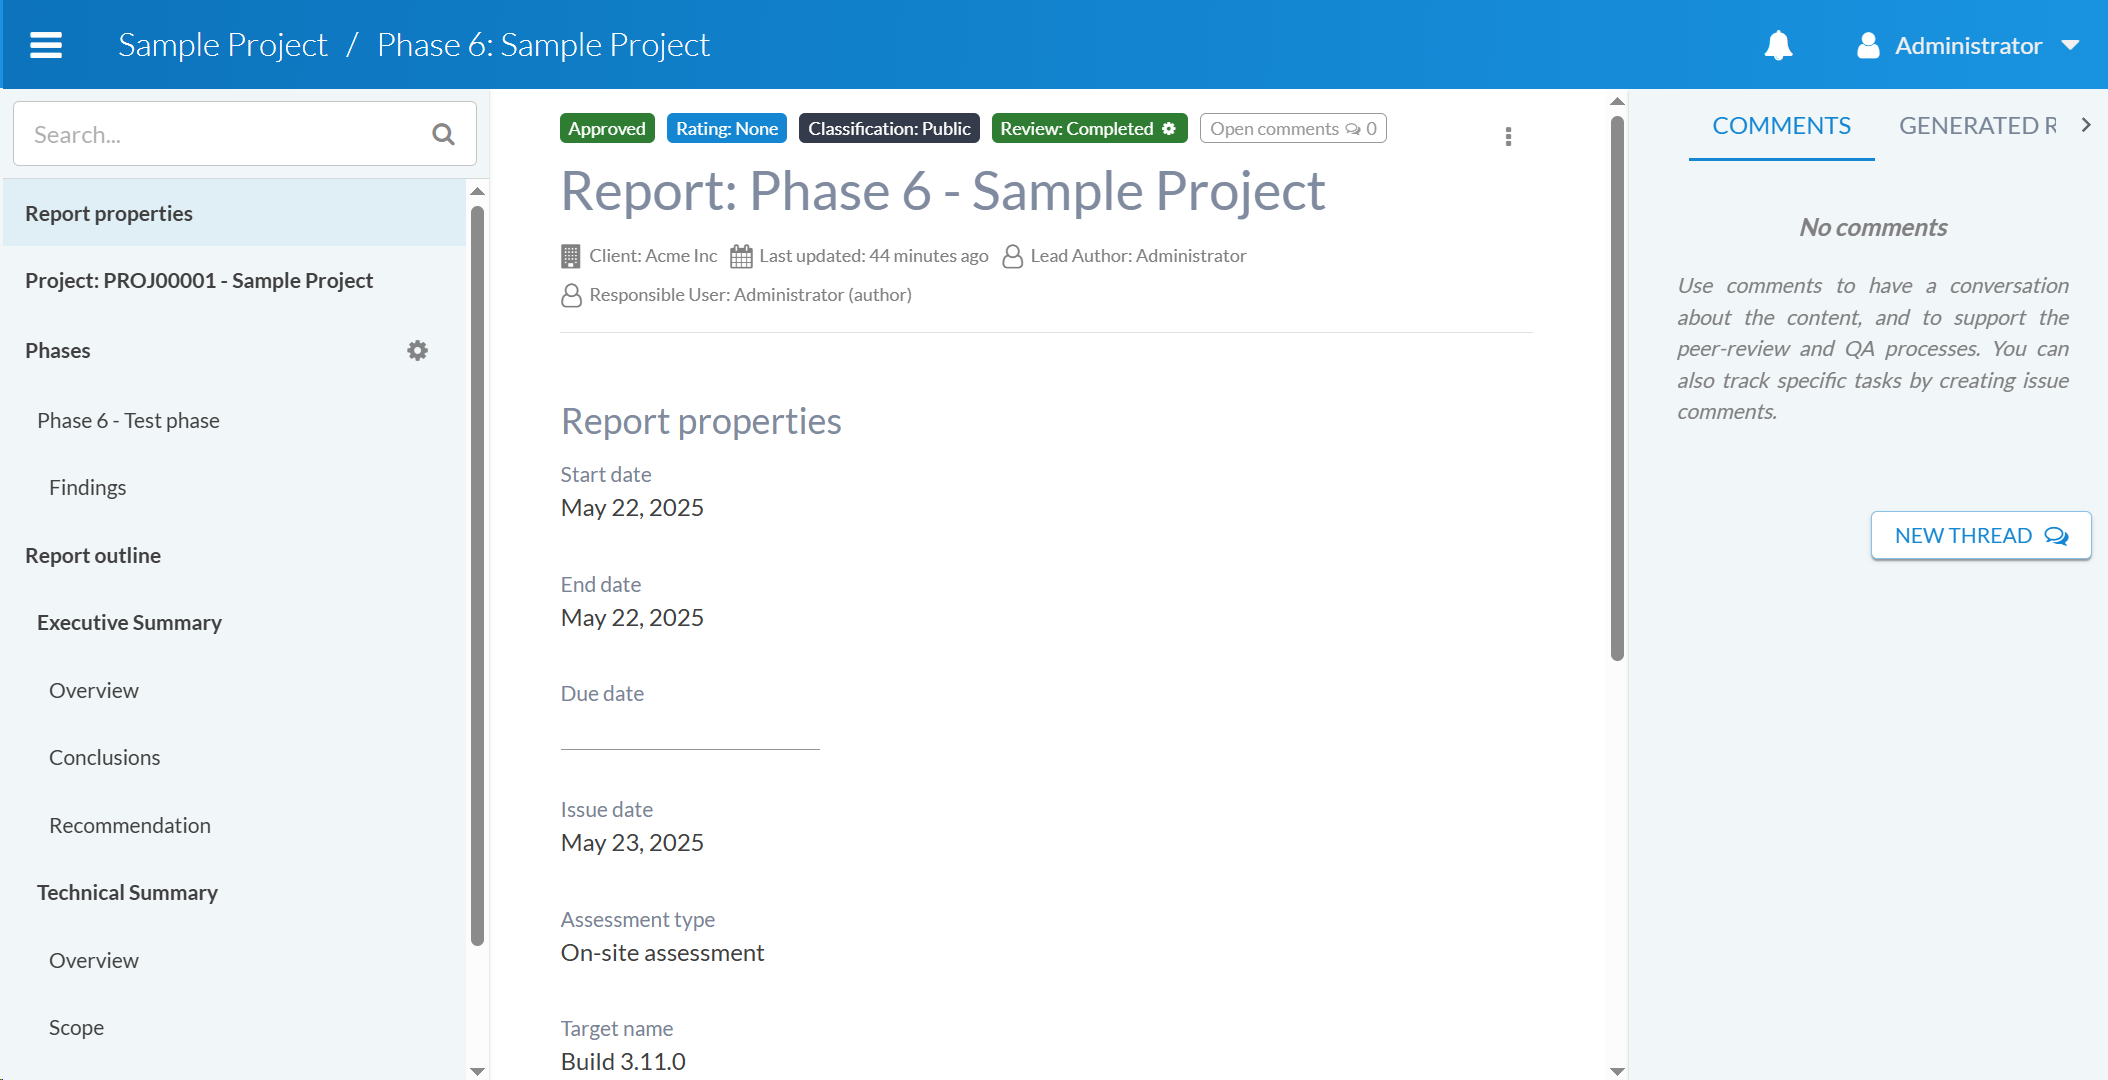
Step 8: Peer review (PR) and quality assurance (QA) a report
The PR/QA workflow is launched via the header section at the top of the
report by clicking on the “Review: Start” button  :
:
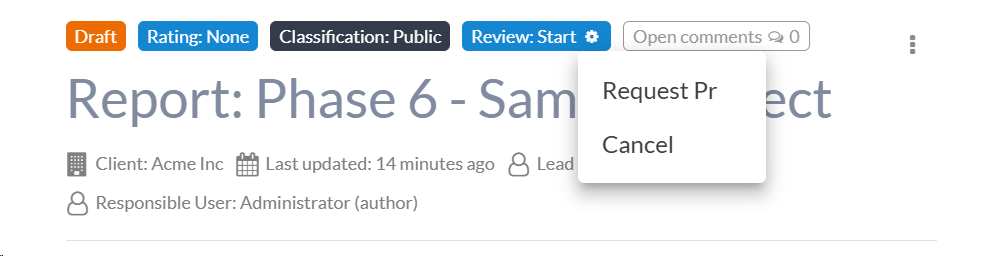
Once a PR or a QA is requested, the users with the PR/QA roles will receive a notification from the system. PR/QA requests are handled on a first-come, first-serve basis. Once a user has accepted a PR/QA request, no other users can accept it, unless it is put back in the PR/QA queue.
Step 9: Generate a report
Once the report has been through PR/QA, the author can now accept the report and it will be marked as completed from a QA perspective.
Tip
It is not mandatory to follow the PR/QA process. However, it is recommended in most scenarios.
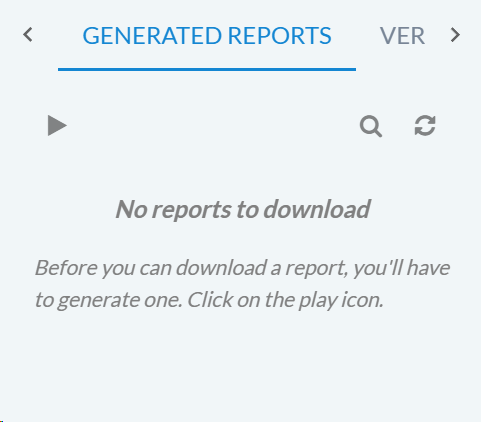
When viewing a report, you can click on the Play button  to generate a
new report.
to generate a
new report.
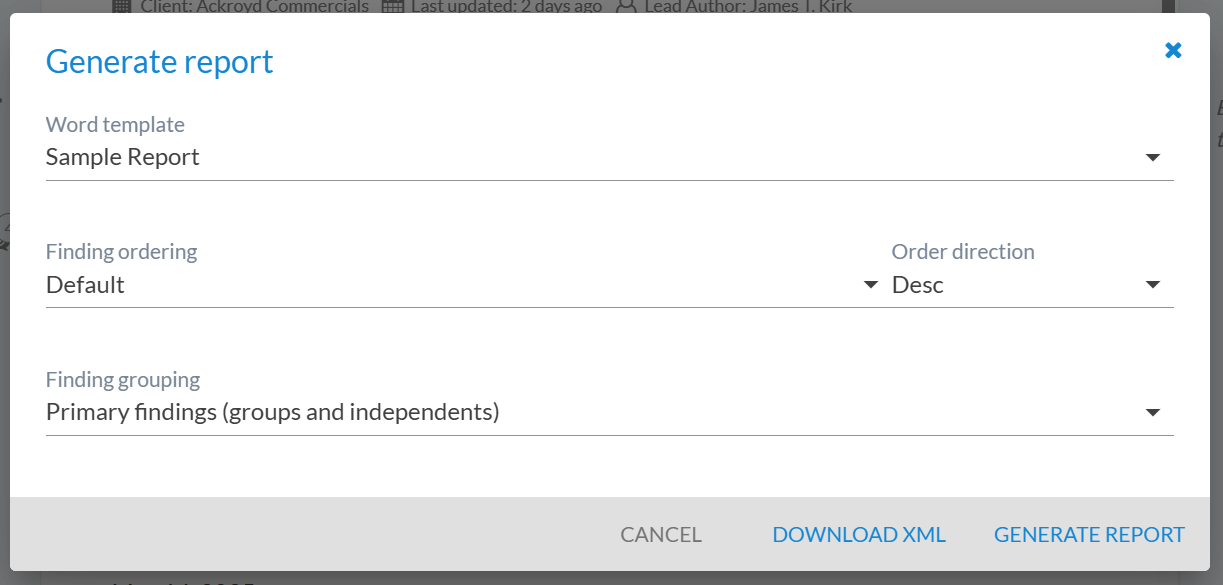
This will open a form where you can select the report template and configure options for the report generation.
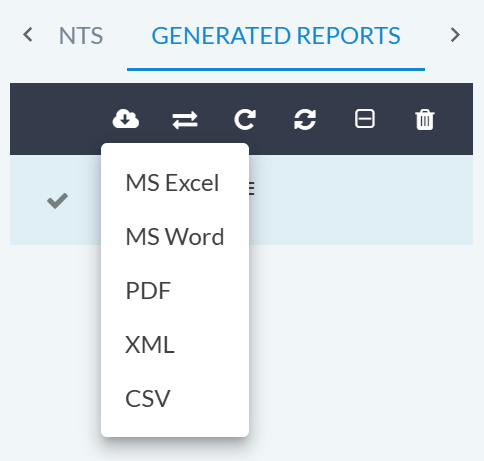
The report can then be exported in multiple different formats:
Emailing of reports directly from Canopy will be added in an upcoming release.
Further information
This document provides an overview of the most typical workflow in Canopy. For further information in general on using Canopy in more detail, see the User guide. For information on setting up and administering Canopy, see the Administration guide.