Understanding the Dashboard
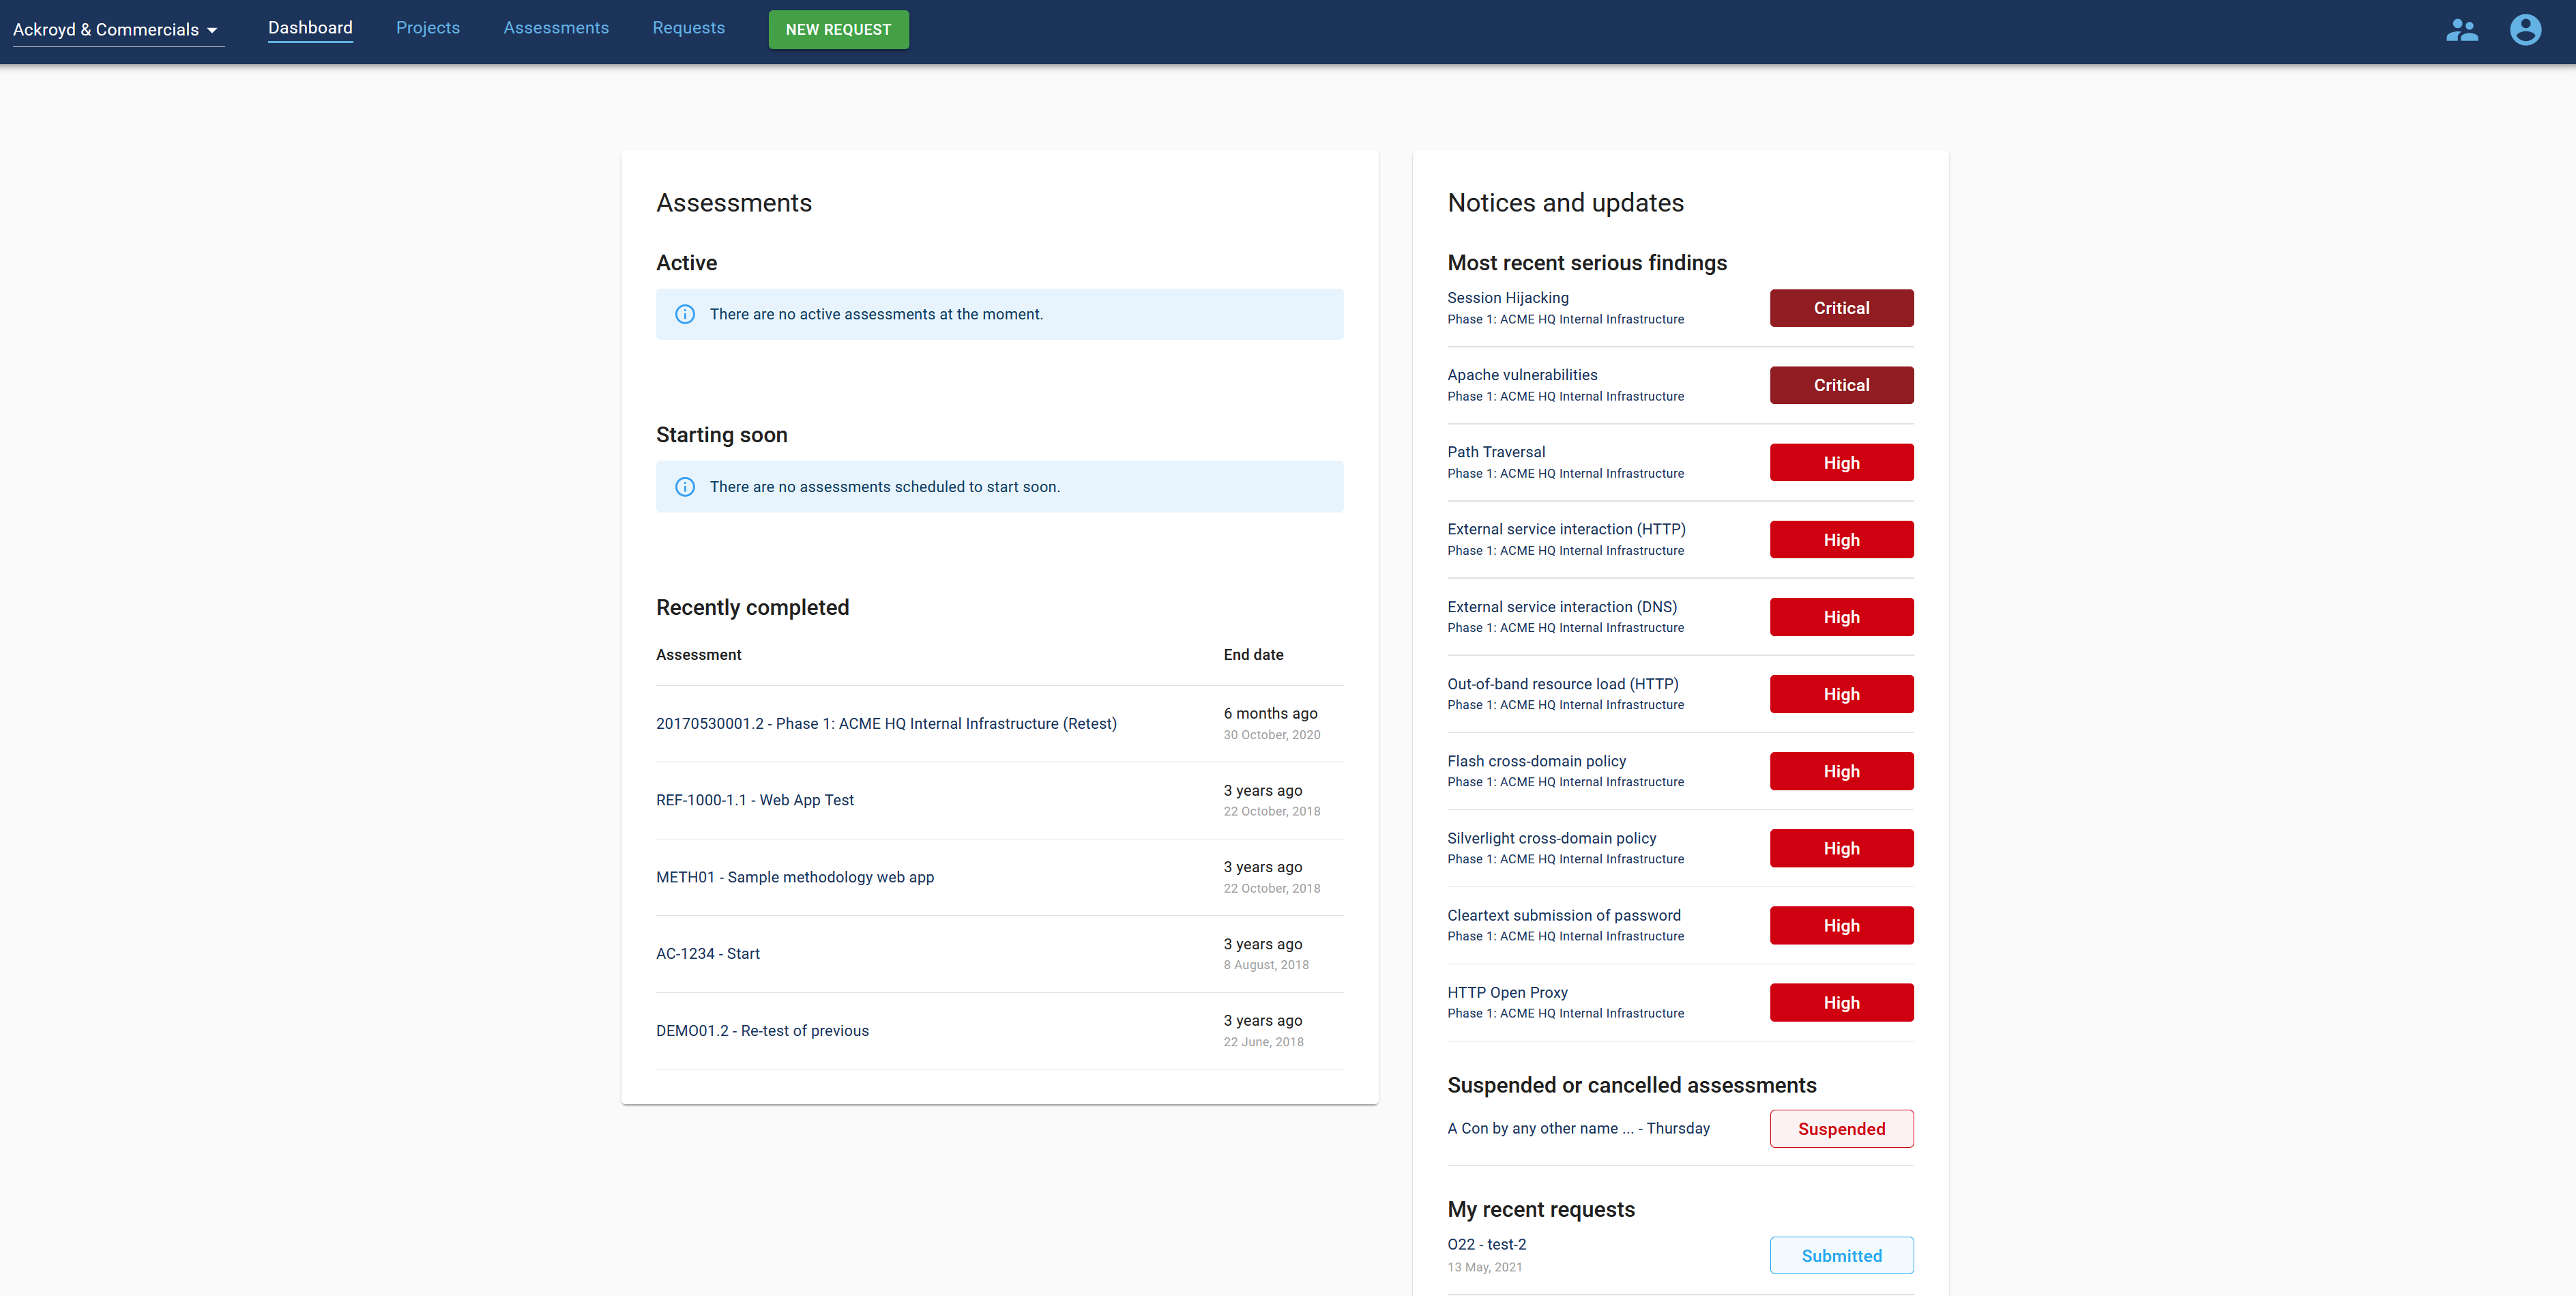
When you log in to Portal, you will be presented with the Dashboard:

From here, we can see key information, such as:
Active: what are my currently active assessments.
Starting soon: which of my assessments are scheduled to start soon.
Recently completed: what assessments completed recently.
Most recent serious findings: shows a list of recently reported Critical and High severity vulnerabilities.
Suspended or cancelled assessments: this shows any assessments that have been cancelled (by you or by the team performing testing) or suspended (by the team - e.g. in the event of the environment not being ready).
My recent requests: shows a list of requests and their current state made by you recently.
Note
The Dashboard is filtered based on the organization you are currently accessing. If you are assigned to multiple organizations, you will need to switch organizations to view the assessments and requests for that organization.
From the Dashboard, you can access the other functionality within the Portal, such as viewing Projects, Assessments and creating new Requests.